Fitting and Extrapolating U.S. Census Data
By Cleve Moler, MathWorks
“Growth of U.S. Population Is at Slowest Pace Since 1937." This New York Times headline prompted me to revisit an old chestnut: fitting and extrapolating census data. In the process, I have added a couple of nonlinear fits, namely, the logistic curve and the double exponential Gompertz model.
The experiment is older than MATLAB®. It started as an exercise in Computer Methods for Mathematical Computations, by Forsythe, Malcolm, and Moler, published 40 years ago. We were using Fortran back then. The data set has been updated every ten years since the book was published. Today, MATLAB graphics make it easier to vary the parameters and see the results, but the underlying mathematical principle remains unchanged:
* Using polynomials of even modest degree to predict the future by extrapolating data is a risky business.
The famous New York Yankees catcher and budding computational scientist Yogi Berra once said, "It's tough to make predictions, especially about the future." We’re going to use polynomials, splines, exponentials, and the census app in Cleve’s Laboratory to do just that.
The Data
The data for our experiment comes from the decennial census of the U.S. for the years 1900 to 2010 (numbers are in millions):
    1900     75.995
    1910     91.972
    1920    105.711
    1930    123.203
    1940    131.669
    1950    150.697
    1960    179.323
    1970    203.212
    1980    226.505
    1990    249.633
    2000    281.422
    2010    308.746
The task is to extrapolate the size of the population beyond 2010. Using the censusapp, let's see how an extrapolation of just seven years, from 2010 to 2017, matches the Census Bureau model. Before you read any further, pause and make your own guess.
The Census App
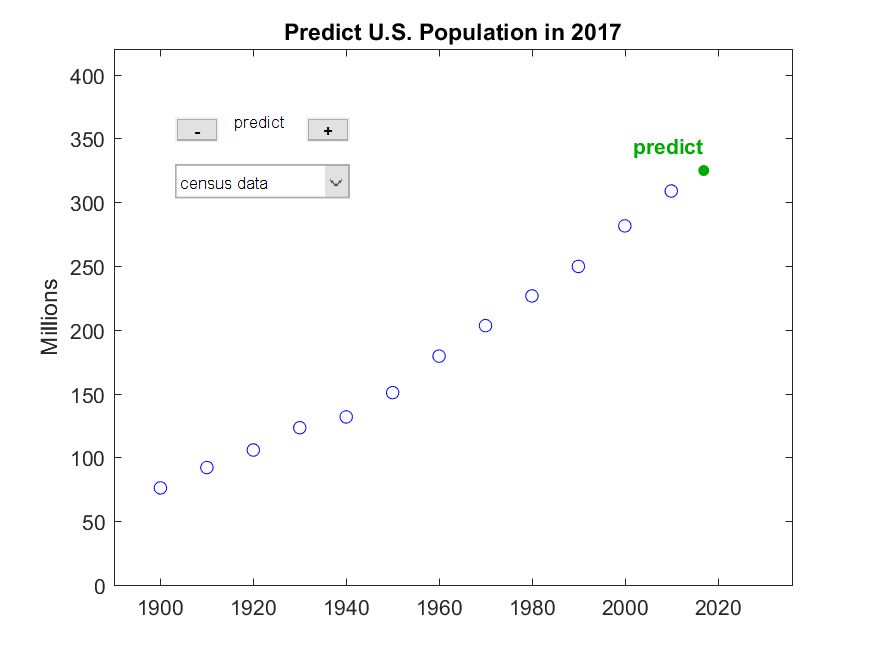
Here's the opening screen of the censusapp. The plus and minus buttons change the extrapolation year in the title. If you go beyond 2030, the plot zooms out.
The app’s pull-down menu offers seven models:
census data
polynomial
pchip
spline
exponential
logistic
gompertz
Forty years ago, we only had polynomials.
The Target Value
The United States Census Bureau website provides a dynamic population clock that operates continuously. Here is the snapshot taken at noon, EDT, on Census Day, April 1, 2017. This is the designated time to capture the census value for the year.

The population clock on April 1, 2017.
So, the target value for extrapolating the census data to 2017 is 324.790 million.
Using Polynomials
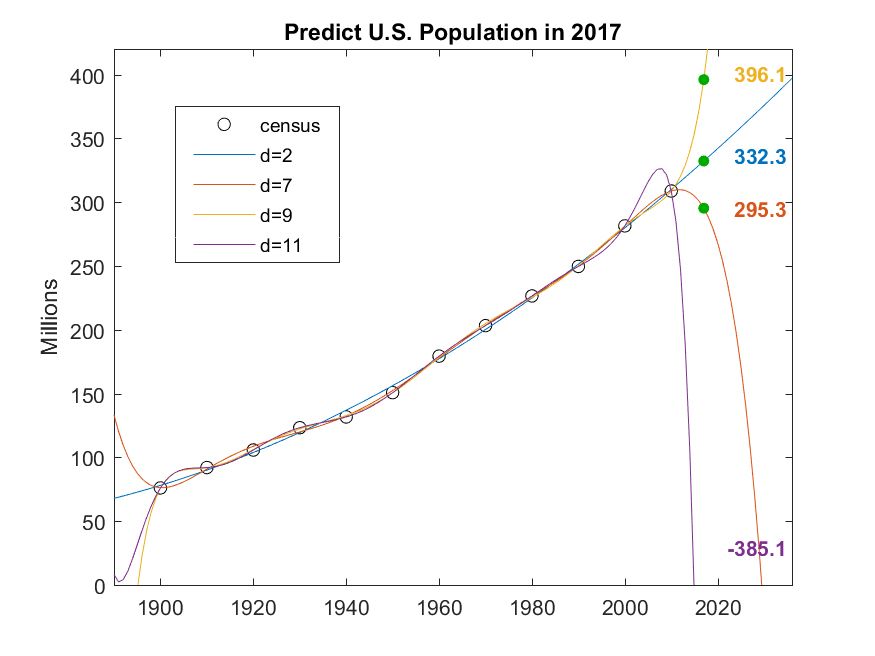
Polynomials like to wiggle. Constrained to match data within a particular interval, they go crazy outside that interval. In this experiment, there are 12 data points. The censusapp lets you vary the polynomial degree between 0 and 11. Polynomials with degree less than 11 approximate the data in a least squares sense. The polynomial of degree 11 interpolates the data exactly. As the degree increases, the approximation of the data becomes more accurate, but the behavior beyond 2010 (or before 1900) becomes more violent. Here are degrees 2 and 7, 9, 11, superimposed on one plot.
The quadratic fit is the best behaved. When evaluated at year 2017, it misses the target by 7.5 million, but it fails to predict the decreasing rate of growth observed by the Census Bureau. (Of course, there is no reason to believe that the U.S. population grows in time like a second-degree polynomial.)
The interpolating polynomial of degree 11 tries to escape even before it gets to 2010, and it goes negative late in 2014.
Extrapolating with Splines
MATLAB has two piecewise cubic interpolating polynomials: spline and pchip. The classic spline is smooth because it has two continuous derivatives. Its competitor, pchip, sacrifices a continuous second derivative to preserve shape and avoid overshoots. Neither of these polynomials is intended for extrapolation, but we will use them anyway.
Their behavior beyond the interval is determined by their end conditions. The classic spline uses the so-called not-a-knot condition. It is actually a single cubic in the last two subintervals. That cubic is also used for extrapolation beyond the endpoint. pchip uses just the last three data points to create a different shape-preserving cubic for use in the last subinterval and beyond.
Let's zoom in on spline and pchip.
Both are predicting a decreasing rate of growth beyond 2010, just like the Census Bureau. But spline is painting a gloomy picture. The value of 314.6 million for 2017 is 10 million below the population clock value, and is near the maximum. On the other hand, pchip gets lucky, and its 2017 value of 325.1 million comes within 0.3 million of the population clock value. Looking into the future, pchip reaches a maximum of 360.2 million in 2047. That’s a prediction to ponder.
Three Exponentials
As I said, there is no good reason to model population growth by a polynomial, piecewise or not. But because we can expect a growth rate proportional to the size of the population, there is good reason to use an exponential.
\[p(t) \approx \alpha\:\text{e}^{bt}\]
Many authors have proposed ways to modify this model to avoid its unbounded growth. I have added two of these to the censusapp. One is the logistic model.
\[p(t) \approx \alpha/(1+b\:\text{e}^{-ct})\]
The other is the Gompertz double exponential model, named after Benjamin Gompertz, a 19th-century, self-educated British mathematician and astronomer.
\[p(t) \approx \alpha\:\text{e}^{-b\:\text{e}^{-ct}}\]
In both models the growth is limited because the approximating term approaches \(\alpha\) as \(t\) approaches infinity.
In all three of the exponential models, the parameters \(\alpha\), \(b\), and possibly \(c\), appear nonlinearly. In principle, I could use lsqcurvefit to search in two or three dimensions for a least squares fit to the census data. But I have an alternative: By taking one or two logarithms, I obtain a separable least squares model where, at most, one parameter, \(\alpha\), appears nonlinearly.
For the exponential model, take one logarithm.
\[\text{log}\:p \approx \text{log}\:\alpha + bt\]
Fit the logarithm of the data by a straight line and then exponentiate the result. No search is required.
For the logistic model, take one logarithm.
\[\text{log}\:(\alpha/p-1) \approx \text{log}\:b-ct\]
For any value of \(\alpha\), the parameters log \(b\) and \(c\) appear linearly and can be found without a search. So, use a one-dimensional minimizer to search for \(\alpha\). I could use fminbnd or its textbook version, fmintx, from Numerical Methods with MATLAB.
For the Gompertz model, take two logarithms.
\[\text{log}\:\text{log}\:\alpha/p \approx \text{log}\:b-ct\]
Again, do a one-dimensional search for the minimizing \(\alpha\), solving for log \(b\) and \(c\) at each step.
I should point out that taking logarithms changes the fit criterion. I am doing a least squares fit to the log of the data, not to the actual data.
Results
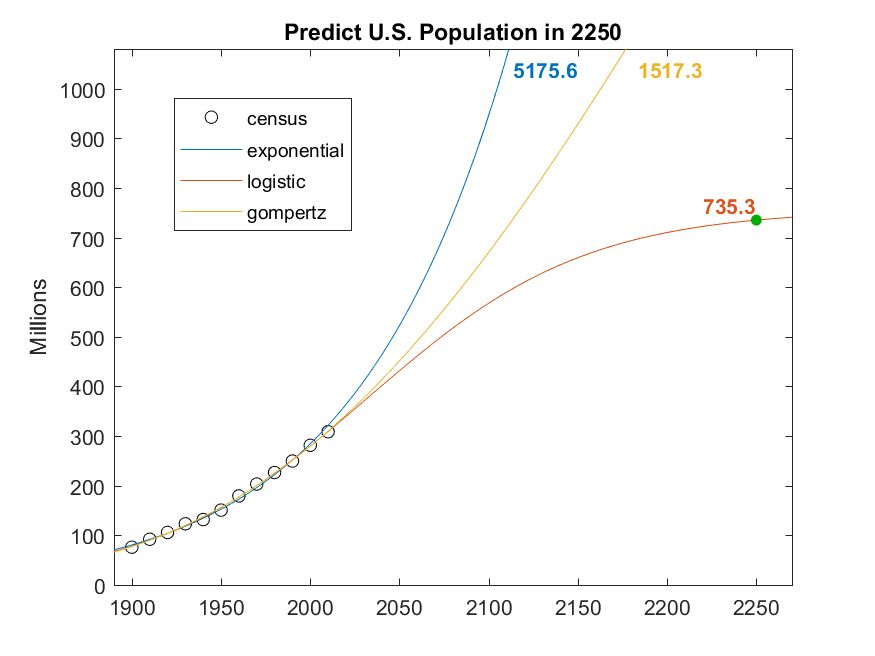
Here are the three resulting fits, extrapolated over more than 200 years to the year 2250.
The pure exponential model reaches 5 billion by that time, and is growing ever faster. I think that's unreasonable.
The value of \(\alpha\) in the Gompertz fit turns out to be 4309.6, so the population will be capped at 4.3 billion. But it has only reached 1.5 billion 200 years from now. Again, unlikely.
The value of \(\alpha\) in the logistic fit turns out to be 756.4, so the predicted U.S. population will slightly more than double over the next 200 years. Despite the Census Bureau's observation that our rate of growth has slowed, we are not yet even halfway to our ultimate population limit.
I'll let you be the judge of that prediction.
Published 2017 - 93130v00


