Automatic Meter Reading
This example shows you how to use Communications Toolbox™ to read utility meters by processing Standard Consumption Message (SCM) signals and Interval Data Message (IDM) signals which are emitted by Encoder-Receiver-Transmitter (ERT) compatible meters. You can either use recorded data from a file, or receive over-the-air signals in real time using an RTL-SDR or ADALM-PLUTO radio.
In Simulink®, you can explore the Automatic Meter Reading in Simulink example.
Required Hardware and Software
To run this example using recorded data from a file, you need Communications Toolbox™.
To receive signals in real time, you also need one of these SDR devices and the corresponding software add-on:
RTL-SDR radio and the Communications Toolbox Support Package for RTL-SDR Radio add-on
ADALM-PLUTO radio and the Communications Toolbox Support Package for Analog Devices® ADALM-PLUTO Radio add-on
For more information, see the Software Defined Radio (SDR) discovery page.
Background
Automatic Meter Reading (AMR) is a technology that autonomously collects the consumption and status data from utility meters (such as electric, gas, or water meters) and delivers the data to utility providers for billing or analysis purposes. The AMR system utilizes low power radio frequency (RF) communication to transmit meter readings to a remote receiver. The RF transmission properties include:
Transmission frequency within range: 910-920 MHz
Data rate: 32768 bps
On-off keyed Manchester coded signaling
The SCM and IDM are two types of the conventional message types that the meters send out. The SCM packets are used with a fixed length of 96 bits, whereas IDM packets are used with a fixed length of 736 bits. These tables show the packet format of the SCM and IDM messages:

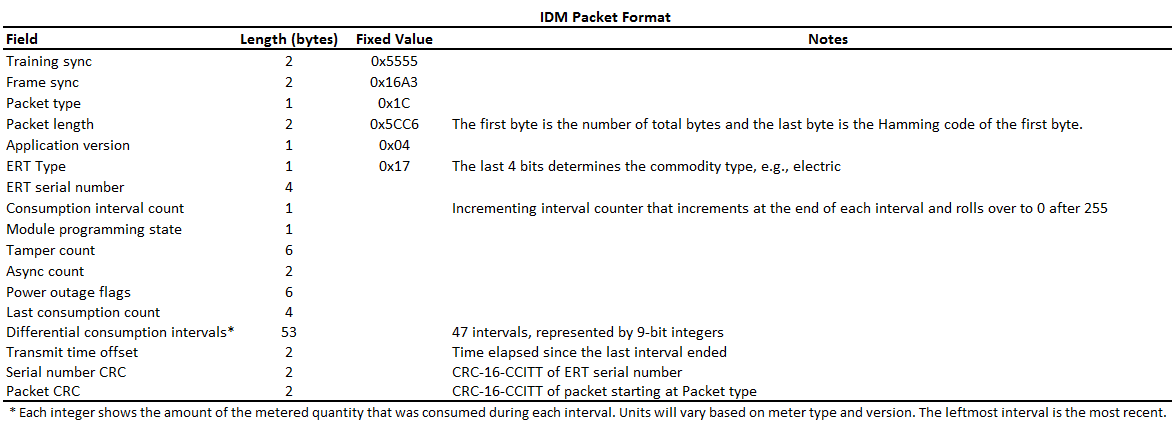
Meters capable of sending both SCM and IDM messages transmit them on the same channel with separation of roughly 275 msec. Each meter transmits the SCM and IDM messages over multiple frequencies using a hopping pattern. The actual transmission frequencies, the frequency hopping pattern, and the time interval between transmissions are random to avoid interference from other transmissions. For more information, see reference [ 1 ].
Run Example
When you run the example:
The receiver initializes the simulation parameters and calculates the AMR parameters.
A data viewer display shows the meter ID, consumption information, and commodity type.
The simulation loop calls the signal source, physical layer, message parser, and data viewer.
The processing loop keeps track of the radio time using the frame duration.
The display updates for each data capture, showing unique meter IDs with the latest consumption information.
Initialize Parameters
The default signal source is 'File', which runs the example using the recorded baseband signal file amr_capture_01.bb. To run the example using your RTL or ADALM-PLUTO SDR, change the setting for signalSource when you call the helperAMRInit.m file. Valid options for signalSource are 'File', 'RTL-SDR', and 'ADALM-PLUTO'.
signalSource = 'File';
initParam = helperAMRInit(signalSource);

% Calculate AMR system parameters based on the initialized parameters
[amrParam,sigSrc] = helperAMRConfig(initParam);

% Create the data viewer object
viewer = helperAMRViewer('MeterID',initParam.MeterID, ...
    'LogData',initParam.LogData, ...
    'LogFilename',initParam.LogFilename, ...
    'Fc',amrParam.CenterFrequency, ...
    'SignalSourceType',initParam.SignalSourceType);

start(viewer);
radioTime = 0; % Initialize the radio time

% Main Processing Loop
while radioTime < initParam.Duration
    rcvdSignal = sigSrc();
    amrBits = helperAMRRxPHY(rcvdSignal,amrParam);
    amrMessages = helperAMRMessageParser(amrBits,amrParam);
    update(viewer,amrMessages);
    radioTime = radioTime + amrParam.FrameDuration;
end

stop(viewer); % Stop the viewer
release(sigSrc); % Release the signal source
Receiver Code Structure
The flow chart summarizes the receiver code structure. The processing has four main parts: Signal Source, Physical Layer, Message Parser and Data Viewer.

Signal Source
This example can use three signal sources:
''File'': Over-the-air signals written to a file and read using a Baseband File Reader object at 1.0 Msps
''RTL-SDR'': RTL-SDR radio at a sample rate of 1.0 Msps
''ADALM-PLUTO'': ADALM-PLUTO radio at a sample rate of 1.0 Msps
If you assign ''RTL-SDR'' or ''ADALM-PLUTO'' as the signal source, the example searches your computer for the radio you specified, either an RTL-SDR radio at radio address '0' or an ADALM-PLUTO radio at radio address 'usb:0' and uses it as the signal source.
Physical Layer
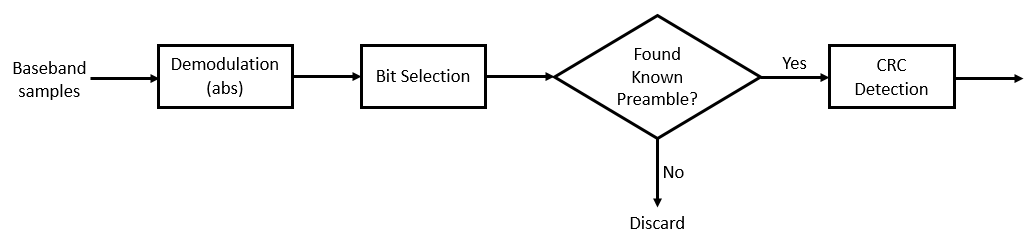
The baseband samples received from the signal source are processed by the physical layer (PHY) to produce packets that contain the SCM or IDM information. This diagram shows the physical layer receive processing.
The RTL-SDR radio is capable of using a sampling rate in the range of 225-300 kHz or 900-2560 kHz. The ADALM-PLUTO radio is capable of using a sampling rate in the range of 520 kHz-61.44 MHz. A sampling rate of 1.0 Msps is used to produce a sufficient number of samples per Manchester encoded data bit. For each frequency in the hopping pattern, every AMR data packet is transmitted. The frequency hopping allows for increased reliability over time. Since every packet is transmitted on each frequency hop, it is sufficient to monitor only one frequency for this example. The radio is tuned to a center frequency of 915 MHz for the entire simulation runtime.
The received complex samples are amplitude demodulated by extracting their magnitude. The on-off keyed Manchester coding implies the bit selection block includes clock recovery. This block outputs bit sequences (ignoring the idle times in the transmission) which are subsequently checked for the known preamble. If the preamble matches, the bit sequence is further decoded, otherwise, it is discarded and the next sequence is processed.
When the known SCM preamble is found for a bit sequence, the received message bits are decoded using a shortened (255,239) BCH code which can correct up to two bit errors. In the case where the known IDM preamble is found, the receiver performs a cyclic redundancy check (CRC) of the meter serial number and of the whole packet starting at the Packet type (the 5th byte) to determine if the packet is valid. Valid, corrected messages are passed onto the AMR message parser.
Message Parser
For a valid message, the bits are then parsed into the specific fields of the SCM or the IDM format.
Data Viewer
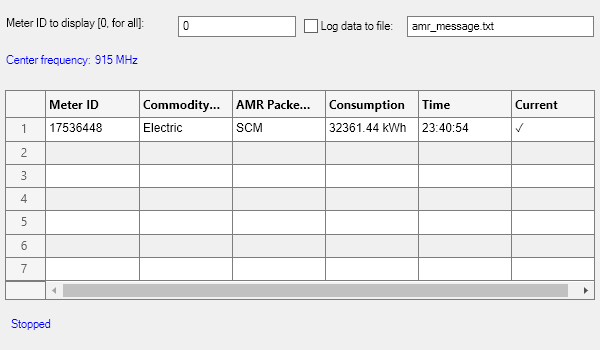
The data viewer shows the decoded packets on a separate MATLAB® figure. For each successfully decoded packet, the meter ID, commodity type, AMR packet type, consumption information and the capture time is shown. As data is captured and decoded, the application lists the information decoded from these messages in a tabular form. The table lists only the unique meter IDs with their latest consumption information.
You can also change the meter ID and start text file logging using the data viewer.
Meter ID - Change the meter ID from 0, which is the default value and is reserved for displaying all detected meters, to a specific meter ID which you would like to be displayed.
Log data to file - Save the decoded messages in a TXT file. You can use the saved data for post processing.
Further Exploration
The data file accompanying the example has only one meter reading and has been captured at center frequency of 915 MHz. Using RTL-SDR or ADALM-PLUTO, the example will display readings from multiple meters when it is run for a longer period in a residential neighborhood.
You can further explore AMR signals using the AMRExampleApp user interface. This app allows you to select the signal source and change the center frequency of the RTL-SDR or ADALM-PLUTO. This link launchs the AMRExampleApp app shown here.

You can also explore the following functions for details of the physical layer, AMR message formats:
For a version of the example that works with multiple radios, see AMRMultipleRadios.m. The multiple radio version allows you to examine the frequency hop patterns for a meter by setting different center frequencies per radio device available. The script is set for two radios, but can be extended for any number.
Selected Bibliography
Automatic meter reading, https://en.wikipedia.org/wiki/Encoder_receiver_transmitter, 2016.
Itron Electricity meters, https://www.itron.com/solutions/who-we-serve/electricity, 2017.
You can also select a web site from the following list:
Americas
- América Latina (Español)
- Canada (English)
- United States (English)
Europe
- Belgium (English)
- Denmark (English)
- Deutschland (Deutsch)
- España (Español)
- Finland (English)
- France (Français)
- Ireland (English)
- Italia (Italiano)
- Luxembourg (English)
- Netherlands (English)
- Norway (English)
- Österreich (Deutsch)
- Portugal (English)
- Sweden (English)
- Switzerland
- United Kingdom (English)