Plot Complex Numbers
This example shows how to plot complex numbers in MATLAB®. A complex number is a number that can be written in the form
,
where and are real numbers, and is the imaginary unit, which is defined as . The number is the real part of the complex number, which is denoted by , and the number is the imaginary part of the complex number, which is denoted by . You can plot a complex number as a pair of coordinates on the complex plane, also known as the Argand diagram. This diagram uses the Cartesian coordinates to represent the real part in the -axis and the imaginary part in the -axis.
You can also represent a complex number using the polar representation. The complex number is written in the form
,
where is the absolute value or magnitude of the complex number, and is the phase angle of the complex number. In this representation, you can plot a complex number as a point in the polar coordinates with radius (the distance from the origin) and polar angle (the counterclockwise angle between the positive real axis and the line connecting the point to the origin).
Plot Array of Complex Numbers
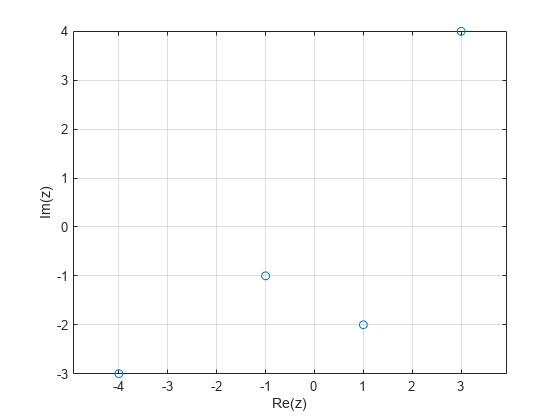
Create a vector that contains the complex numbers 3 + 4i, -4 - 3i, 1 - 2i, and -1 - 1i.
z = [3 + 4i; -4 - 3i; 1 - 2i; -1 - 1i]
z = 4×1 complex

   3.0000 + 4.0000i
  -4.0000 - 3.0000i
   1.0000 - 2.0000i
  -1.0000 - 1.0000i
Plot the imaginary part against the real part of the complex vector z by using plot. Use the real function and imag function to return the real and imaginary parts of the complex vector, respectively.
plot(real(z),imag(z),"o")
axis equal
grid on
xlabel("Re(z)")
ylabel("Im(z)")
You can also use plot(z,LineSpec) instead of plot(real(z),imag(z),LineSpec) to plot an array of complex numbers. This function automatically plots the real part in the -axis and the imaginary part in the -axis.
Plot Complex Roots of Unity in Cartesian Coordinates
The th roots of unity are complex numbers that satisfy the polynomial equation
,
where is a positive integer.
The th roots of unity are
, for .
To find the complex roots of unity, you can solve the polynomial equation by using roots. The roots function solves polynomial equations of the form . For example, find the fifth roots of unity of , or .
p = [1 0 0 0 0 -1];
z = roots(p)
z = 5×1 complex

  -0.8090 + 0.5878i
  -0.8090 - 0.5878i
   0.3090 + 0.9511i
   0.3090 - 0.9511i
   1.0000 + 0.0000i
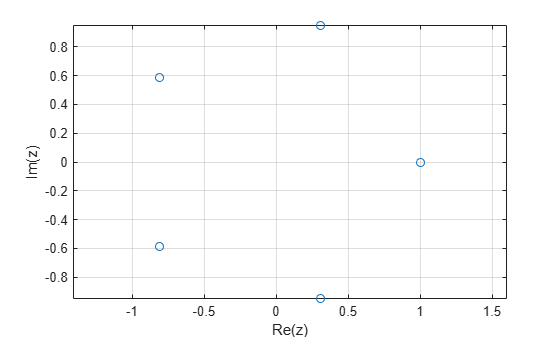
Plot the complex roots of unity in the Cartesian coordinates.
plot(z,"o")
axis equal
grid on
xlabel("Re(z)")
ylabel("Im(z)")
Plot Complex Numbers in Polar Coordinates
Plot the fifth roots of unity in the polar coordinates by using polarplot. Use the angle function to return the phase angles of the complex roots, and use the abs function to return the absolute values or radii of the complex roots.
polarplot(angle(z),abs(z),"o")
You can also use polarplot(z,LineSpec) instead of polarplot(angle(z),abs(z),LineSpec) to plot an array of complex numbers in the polar coordinates. This function automatically plots the radii and phase angles of the complex numbers.
Plot Parametric Curve in Complex Plane
Define a parametric curve that has the form
with the parameter in the interval .
Create a vector t of 200 equally spaced points within this interval to parameterize . Define the points that lie on the complex curve as a complex vector z.
t = linspace(0,4*pi,200);
z = t.*exp(1i*t);
Plot the complex curve in the Cartesian coordinates.
plot(z,"-")
axis equal
grid on
xlabel("Re(z)")
ylabel("Im(z)")

Plot the complex curve in the polar coordinates.
polarplot(z,"-")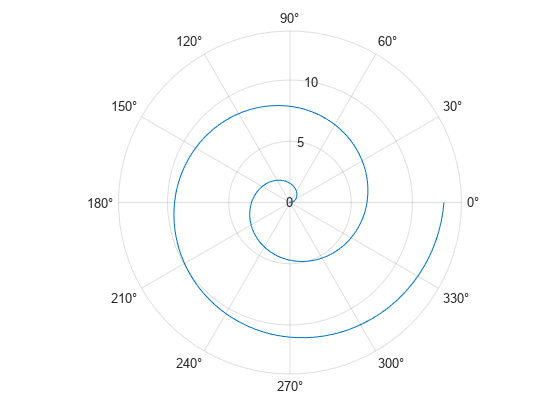
Plot Eigenvalues of Square Matrix
A real -by- square matrix has eigenvalues (counting algebraic multiplicities) that either are real or occur in complex conjugate pairs.
For example, consider a 20-by-20 real matrix with random elements that are sampled from a standard normal distribution. Calculate the eigenvalues using eig.
rng("default")
z = eig(randn(20));
Plot the imaginary part against the real part of all 20 eigenvalues. Notice that for each eigenvalue that is not on the real axis, there is another complex conjugate pair of this eigenvalue .
plot(z,"o")
axis equal
grid on
xlabel("Re(z)")
ylabel("Im(z)")

Plot Multiple Complex Data Sets
Plot the imaginary part against the real part of two complex data sets. If you pass multiple complex input arguments to plot, such as plot(z1,z2), then the plot function ignores the imaginary part and plots only the real part of the inputs. To plot the real part against the imaginary part for multiple complex inputs, you must explicitly pass the real part and the imaginary part to plot.
For example, create two complex vectors z1 and z2.
x = -2:0.25:2;
z1 = x.^exp(-x.^2);
z2 = 2*x.^exp(-x.^2);
Find the real part and imaginary part of each vector by using the real and imag functions.
re_z1 = real(z1);
im_z1 = imag(z1);
re_z2 = real(z2);
im_z2 = imag(z2);
Plot the complex data.
plot(re_z1,im_z1,"*",re_z2,im_z2,"o")
axis equal
grid on
legend("z1","z2")
xlabel("Re(z)")
ylabel("Im(z)")

See Also
You can also select a web site from the following list:
Americas
- América Latina (Español)
- Canada (English)
- United States (English)
Europe
- Belgium (English)
- Denmark (English)
- Deutschland (Deutsch)
- España (Español)
- Finland (English)
- France (Français)
- Ireland (English)
- Italia (Italiano)
- Luxembourg (English)
- Netherlands (English)
- Norway (English)
- Österreich (Deutsch)
- Portugal (English)
- Sweden (English)
- Switzerland
- United Kingdom (English)