replace
Replace polar plot data with new data
Description
Examples
Replace Cosine Polar Plot with Rotated Cosine Polar Plot
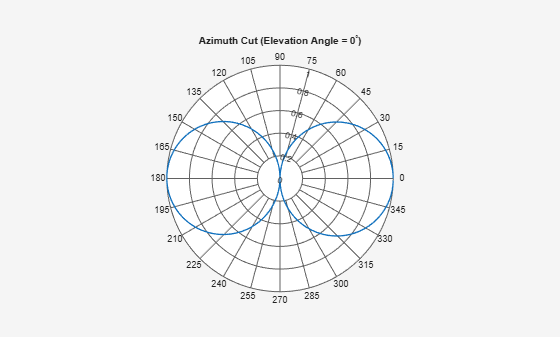
Plot cosine pattern in polar coordinates. Specify a cosine antenna pattern from 0° to 360° in azimuth at 0° elevation. Then, plot the antenna pattern using polarpattern.
Create the pattern.
az = [0:360];
a = abs(cosd(az));
Plot the polar pattern of the antenna for an azimuth cut at 0° elevation.
P = polarpattern(a,'TitleTopTextInterpreter','tex','TitleTop','Azimuth Cut (Elevation Angle = 0^{\circ})');
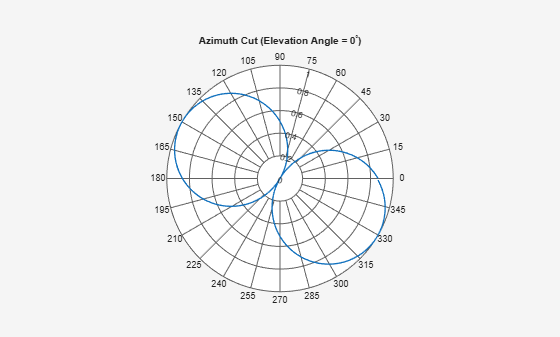
Replace this plot with a rotated cosine pattern.
a = abs(cosd(az + 30.0));
replace(P,a);
Replace Polar Plot Data with New Angle-Magnitude Data
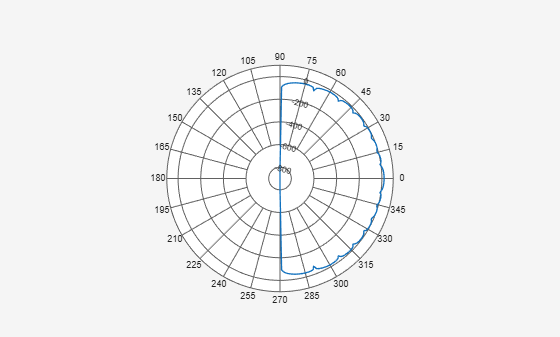
Create a 15-element ULA of cosine antennas with elements spaced one-half wavelength apart. Plot the directivity of the array at 20 GHz.
fc = 20.0e9;
c = physconst('Lightspeed');
lam = c/fc;
angs = [-180:1:180];
antenna = phased.CosineAntennaElement('FrequencyRange',[1.0e9,100.0e9],...
    'CosinePower',[2.5 2.5]);
array = phased.ULA('Element',antenna,'NumElements',15,'ElementSpacing',lam/2);
a = pattern(array,fc,angs,0);
P = polarpattern(angs,a);
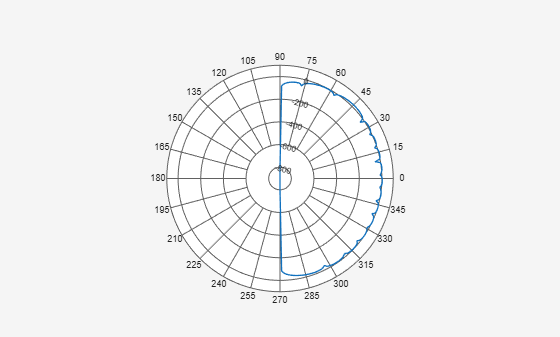
Then, steer the array to 45° and, using the replace method, replace the existing polar plot with the steered array directivity.
steervec = phased.SteeringVector('SensorArray',array,'PropagationSpeed',c,...
    'IncludeElementResponse',true);
sv = steervec(fc,[45;0]);
a1 = pattern(array,fc,angs,0,'Weights',sv);
replace(P,angs,a1);
Input Arguments
Version History
Introduced in R2016a
See Also
add | addCursor | animate | createLabels | findLobes | showPeaksTable | showSpan
You can also select a web site from the following list:
Americas
- América Latina (Español)
- Canada (English)
- United States (English)
Europe
- Belgium (English)
- Denmark (English)
- Deutschland (Deutsch)
- España (Español)
- Finland (English)
- France (Français)
- Ireland (English)
- Italia (Italiano)
- Luxembourg (English)
- Netherlands (English)
- Norway (English)
- Österreich (Deutsch)
- Portugal (English)
- Sweden (English)
- Switzerland
- United Kingdom (English)