Welch Spectrum Estimates
Create a signal consisting of three noisy sinusoids and a chirp, sampled at 200 kHz for 0.1 second. The frequencies of the sinusoids are 1 kHz, 10 kHz, and 20 kHz. The sinusoids have different amplitudes and noise levels. The noiseless chirp has a frequency that starts at 20 kHz and increases linearly to 30 kHz during the sampling.
Fs = 200e3;
Fc = [1 10 20]'*1e3;
Ns = 0.1*Fs;

t = (0:Ns-1)/Fs;
x = [1 1/10 10]*sin(2*pi*Fc*t)+[1/200 1/2000 1/20]*randn(3,Ns);
x = x+chirp(t,20e3,t(end),30e3);
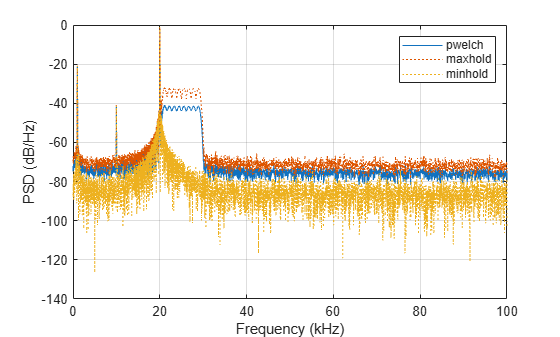
Compute the Welch PSD estimate and the maximum-hold and minimum-hold spectra of the signal. Plot the results.
[pxx,f] = pwelch(x,[],[],[],Fs);
pmax = pwelch(x,[],[],[],Fs,'maxhold');
pmin = pwelch(x,[],[],[],Fs,'minhold');

plot(f/1000,pow2db(pxx))
hold on
plot(f/1000,pow2db([pmax pmin]),':')
hold off
xlabel('Frequency (kHz)')
ylabel('PSD (dB/Hz)')
legend('pwelch','maxhold','minhold')
grid
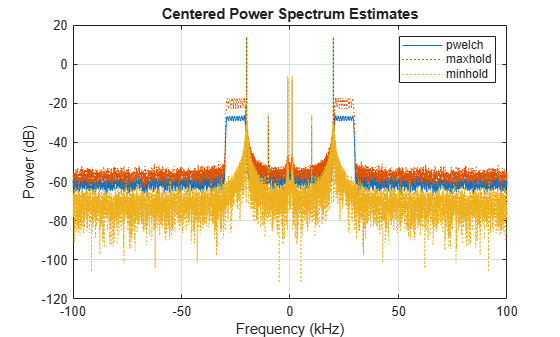
Repeat the procedure, this time computing centered power spectrum estimates.
[pxx,f] = pwelch(x,[],[],[],Fs,'centered','power');
pmax = pwelch(x,[],[],[],Fs,'maxhold','centered','power');
pmin = pwelch(x,[],[],[],Fs,'minhold','centered','power');

plot(f/1000,pow2db(pxx))
hold on
plot(f/1000,pow2db([pmax pmin]),':')
hold off
xlabel('Frequency (kHz)')
ylabel('Power (dB)')
legend('pwelch','maxhold','minhold')
title('Centered Power Spectrum Estimates')
grid