Measure Noise Figure of Device Under Test
Use the Noise Figure Testbench block to measure the noise figure of a device under test (DUT).
Connect the blocks as shown in the model.
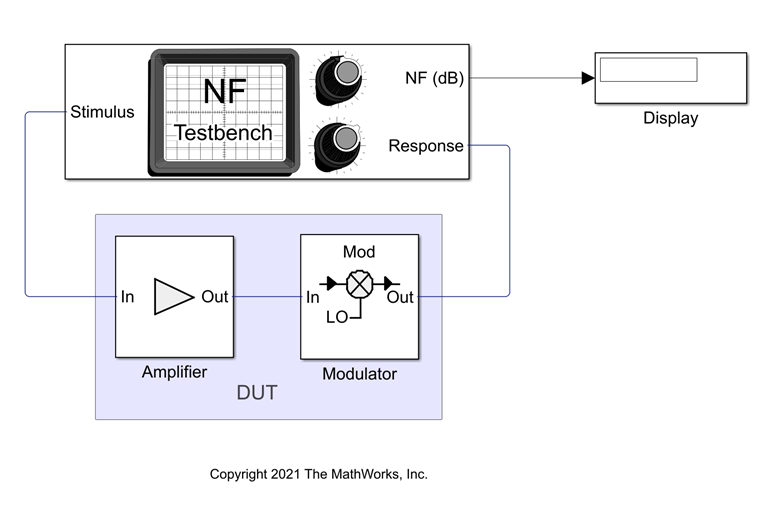
Set the parameters for DUT and the testbench.
Amplifier block:
Available power gain —
10dBNoise type —
Noise figureNoise figure (dB) —
4dB
Mixer block:
Available power gain —
5dBLocal oscillator frequency —
2.0GHzAdd Image Reject filter —
onNoise figure (dB) —
8dBFilter type —
HighpassImplementation —
Constant per carrierPassband edge frequency —
2.05GHz
Noise Figure Testbench block:
Input frequency (Hz) —
2.1e9Output frequency (Hz) —
0.1e9
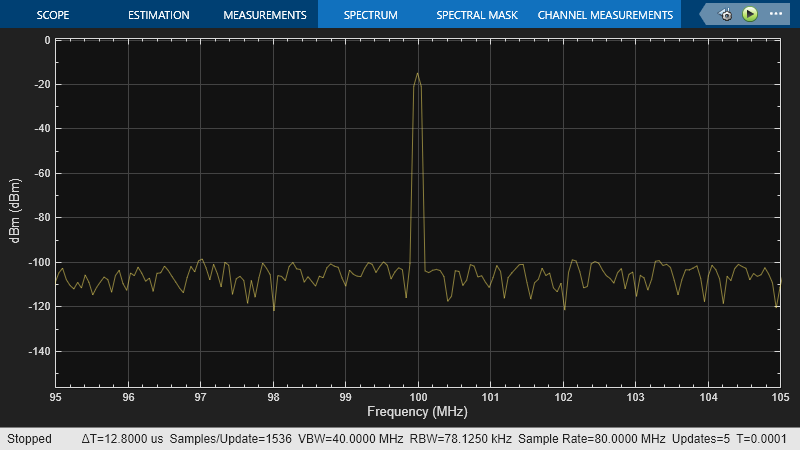
Run the model. You will see that the display shows a OIP3 value of 4.817 dB. This value can be verified analytically using the noise figure (NF) equation provided in [1].
NF_DUT = 10*log10(F_tot) = 10*log10(F_1 + (F_2 – 1)/ A_1)
= 10*log10((10^(4/10)) + (10^(8/10) – 1)/10^(10/10)) = 4.8328 dB
where,
Noise factor of amplifier, F_1 = 10^((4)/10)
Noise factor of mixer, F_2 = 10^((8)/10)
Gain of amplifier, A_1 = 10^(10/10)

References
[1] Razavi, B.. “RF Microelectronics (2nd Edition) (Prentice Hall Communications Engineering and Emerging Technologies Series).” (2011).
See Also
Transducer Gain Testbench | Noise Figure Testbench