Transcritical CO2 (R744) Refrigeration Cycle
This example models a vapor-compression refrigeration cycle in which the high pressure portion of the cycle operates in the supercritical fluid region. The refrigerant is carbon dioxide (CO2), also called R744 in this application.
The compressor drives the flow of CO2 through the cycle and raises the pressure above the critical pressure. The gas cooler rejects heat from the high pressure CO2 to the environment. Because CO2 is in a supercritical state, it does not condense and the temperature decreases. The expansion valve drops the pressure, causing some CO2 to vaporize. The two-phase mixture passes through the evaporator, absorbing heat from the compartment until it is superheated. The internal heat exchanger transfers some heat between the hot and cold side of the cycle to improve the efficiency of the cycle.
Model

Compartment Subsystem
Compressor Subsystem

Controller Subsystem
Evaporator Subsystem
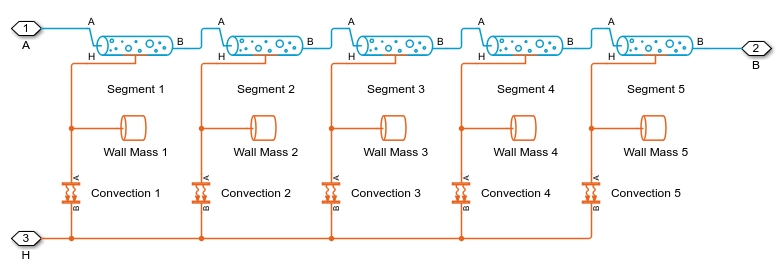
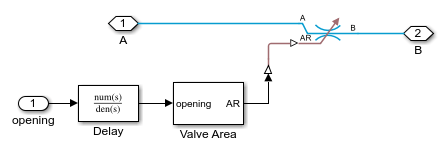
Expansion Valve Subsystem
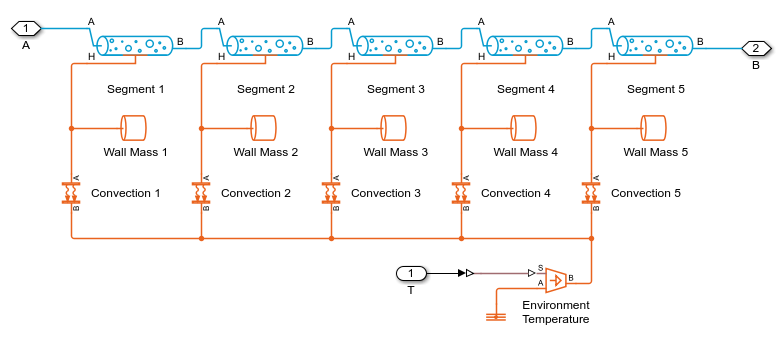
Gas Cooler Subsystem
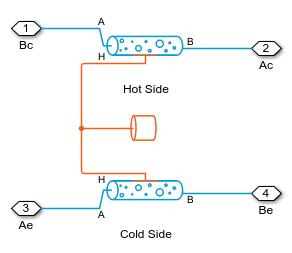
Internal Heat Exchanger Subsystem
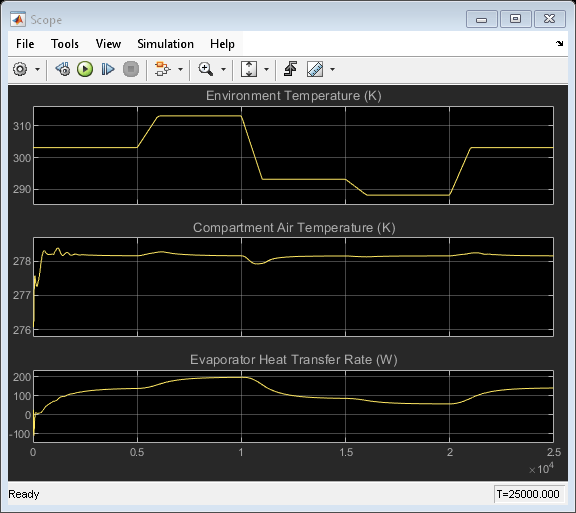
Simulation Results from Scopes
Simulation Results from Simscape Logging
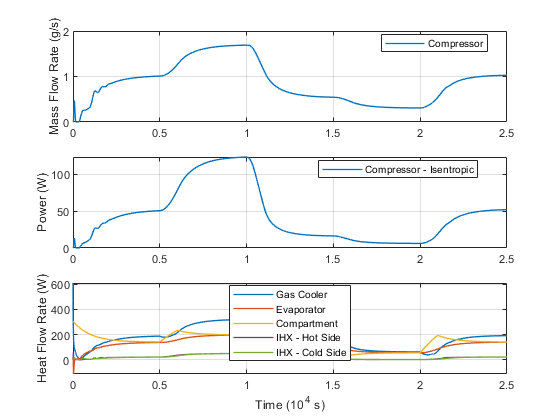
This plot shows mass flow rate, isentropic compressor power input, and heat flow rates in the cycle. The Gas Cooler and Evaporator heat flow rates represent the heat rejection and heat absorption of the cycle, while the IHX heat flow rates are heat transfers within the cycle by the internal heat exchanger.
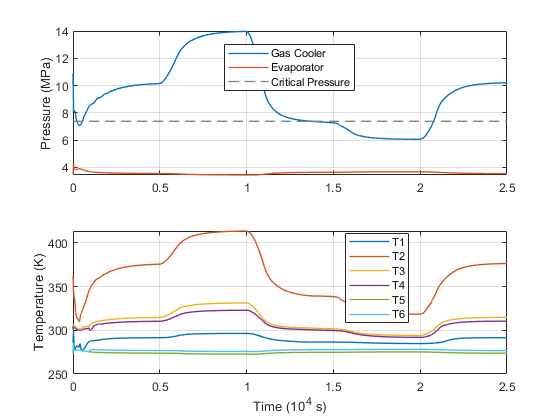
This plot shows the pressure and temperature at different points in the cycle. The evaporator pressure is at kept at around 3.5 MPa and the gas cooler pressure is nominally around 10 MPa, which is above the CO2 (R744) critical pressure of 7.4 MPa. Hence, this is a transcritical refrigeration cycle. The gas cooler pressure changes in response to changing environment temperature. At lower environment temperatures, the gas cooler pressure may drop to subcritical pressures.
Because a two-phase mixture enters the evaporator, the evaporator inlet temperature T5 is also the saturation temperature. Therefore, T6 - T5 represents the superheat in the evaporator, which is controlled by the expansion valve.
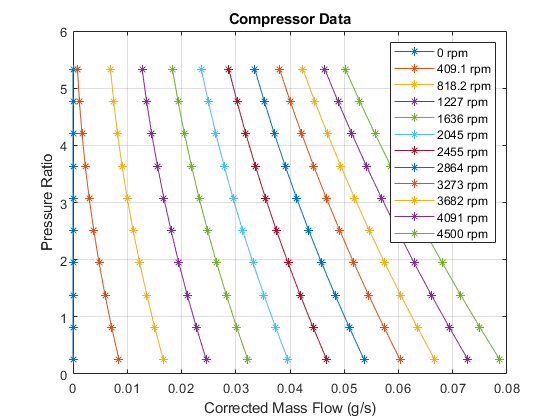
This plot shows the compressor pressure vs flow curves at different shaft speeds. The rotating shaft is not modeled here; the controller directly sets the shaft speed to produce the necessary flow rate.
Animation of Simscape Logging Results
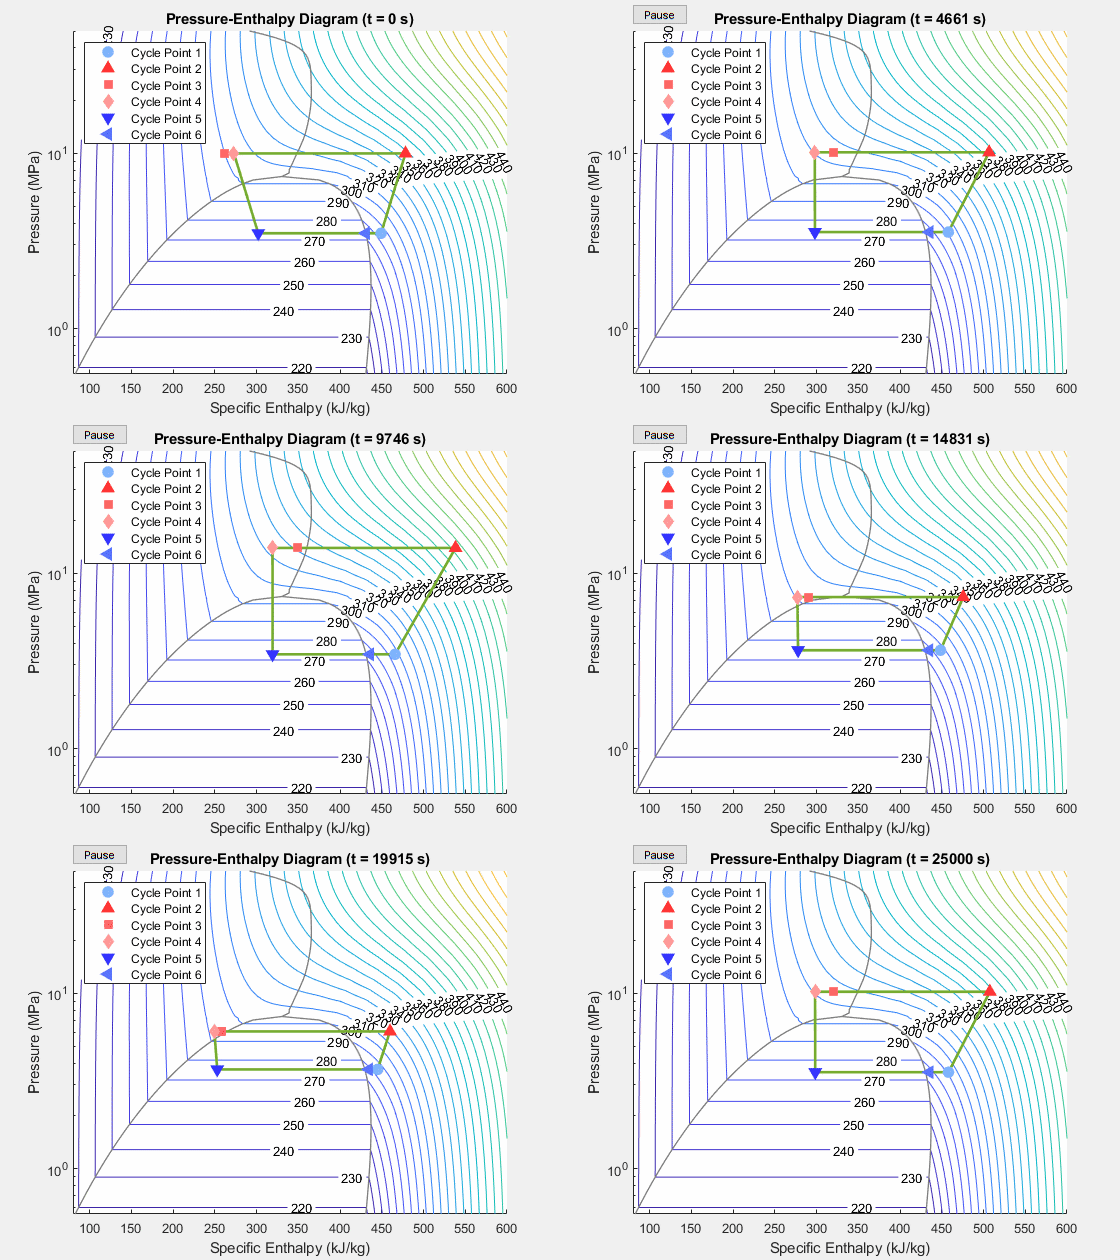
This figure shows the evolution of the fluid states in the transcritical refrigeration cycle over time. The 6 points in the cycle are the compressor inlet, condenser inlet, internal heat exchanger hot side inlet, expansion valve inlet, evaporator inlet, and internal heat exchanger cold side inlet, which are measured by sensors S1 to S6 in the model. They measurements are plotting on a pressure-enthalpy diagram. The contours are isotherms of CO2 (R744).
Fluid Properties
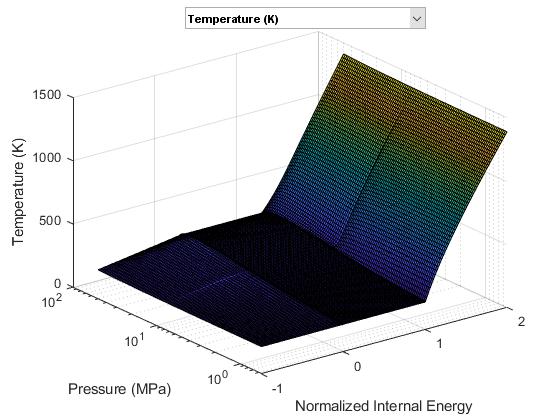
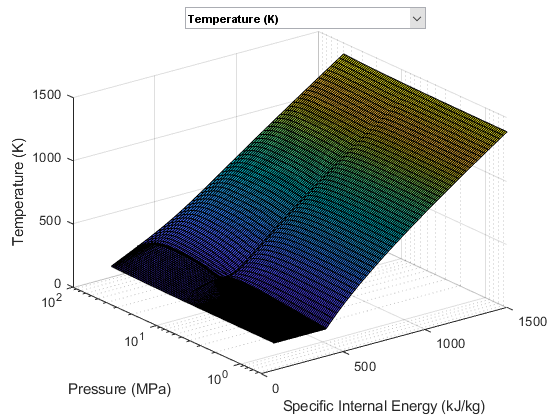
The following two figures plot the fluid properties of CO2 (R744) as a function of pressure (p) and normalized internal energy (unorm) and as a function of pressure (p) and specific internal energy (u), respectively. The fluid is a
subcooled liquid when -1 <= unorm < 0;
two-phase mixture when 0 <= unorm <= 1;
superheated vapor when 1 < unorm <= 2.
The fluid property data is provided as a rectangular grid in p and unorm. Therefore, the grid in terms of p and u is non-rectangular.
The CO2 (R744) fluid property data can be found in CO2PropertyTables.mat.
