frest.simCompare
Namespace: frest
Plot time-domain simulation of nonlinear and linear models
Syntax
frest.simCompare(simout,sys,input)

frest.simCompare(simout,sys,input,x0)

[y,t] = frest.simCompare(simout,sys,input)

[y,t,x] = frest.simCompare(simout,sys,input,x0)
Description
frest.simCompare(simout,sys,input) plots both
Simulation output,
simout, of the nonlinear Simulink® modelYou obtain the output from the
frestimatecommand.Simulation output of the linear model
sysfor the input signalinputThe linear simulation results are offset by the initial output values in the
simoutdata.
frest.simCompare(simout,sys,input,x0) plots
the frequency response simulation output and the simulation output
of the linear model with initial state x0. Because
you specify the initial state, the linear simulation result is not offset
by the initial output values in the simout data.
[y,t] = frest.simCompare(simout,sys,input) returns
the linear simulation output response y and the
time vector t for the linear model sys with
the input signal input. This syntax does not display
a plot. The matrix y has as many rows as time samples (length(t)) and
as many columns as system outputs.
[y,t,x] = frest.simCompare(simout,sys,input,x0) also
returns the state trajectory x for the linear state
space model sys with initial state x0.
Examples
frest.simCompare lets you examine the results of frequency response estimation in the time domain. You can compare the simulated model response to the response of a linear model of the system, such as one obtained by exact linearization.
Estimate the closed-loop response of the plant in the watertank model. First, open the model.
model = 'watertank';
open_system(model)
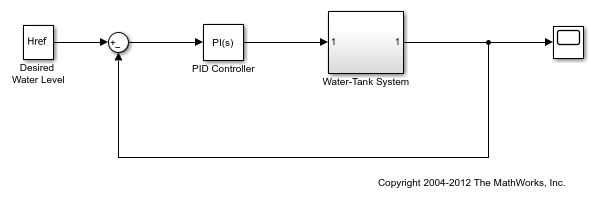
Define a linearization I/O set that specifies the plant, and find a steady-state operating point for estimation.
io(1)=linio('watertank/PID Controller',1,'input');
io(2)=linio('watertank/Water-Tank System',1,'output');

watertank_spec = operspec(model);
opOpts = findopOptions('DisplayReport','off');
op = findop(model,watertank_spec,opOpts);
Create an input signal for estimation. For this example, use a step input.
input = frest.createStep('FinalTime',100);
Estimate the frequency response of the specified portion of the model, using the simout output argument to store the data generated during the estimation process. Also, linearize the model using the same I/O set and operating point.
[sysest,simout] = frestimate(model,op,io,input);
syslin = linearize(model,io,op);
Examine the time-domain responses of the linearized model and the Simulink® model to the same input signal.
frest.simCompare(simout,syslin,input)
legend
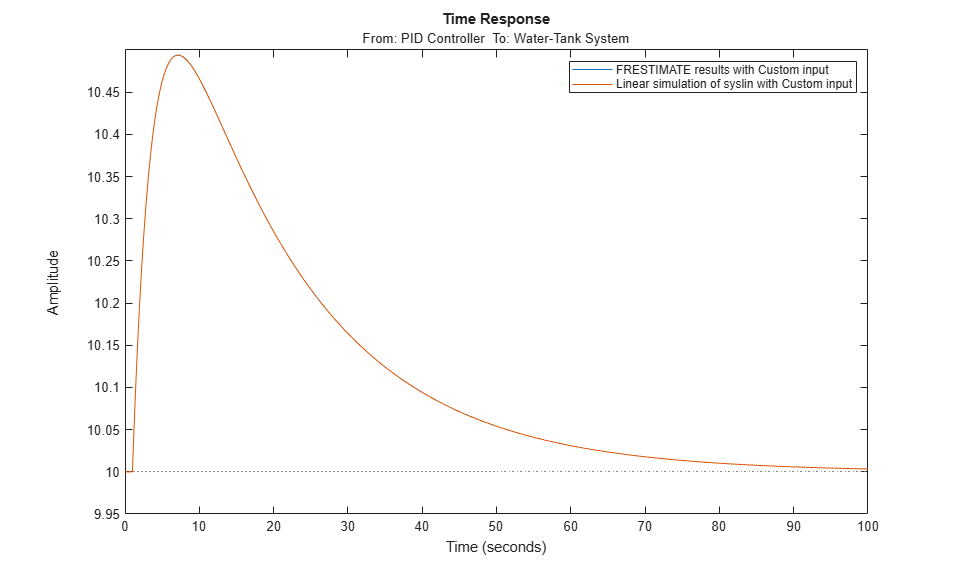
In this example, the responses are virtually identical.
Version History
Introduced in R2009b