Learn Calculus in the Live Editor
Learn calculus and applied mathematics using the Symbolic Math Toolbox™. The example shows introductory functions fplot and diff.
To manipulate a symbolic variable, create an object of type syms.
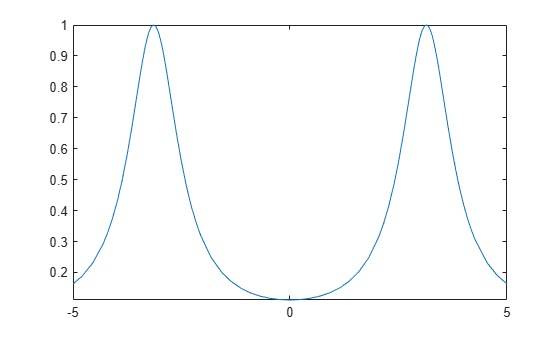
syms xOnce a symbolic variable is defined, you can build and visualize functions with fplot.
f(x) = 1/(5+4*cos(x))
f(x) =
fplot(f)
Evaluate the function at using math notation.
f(pi/2)
ans =
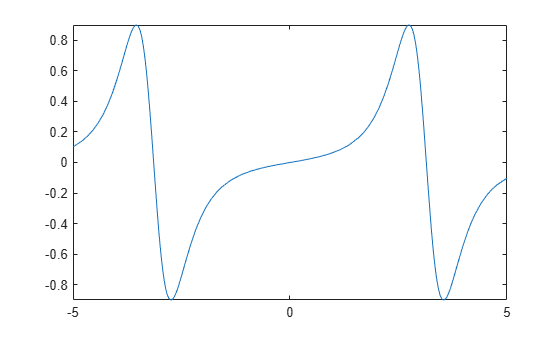
Many functions can work with symbolic variables. For example, diff differentiates a function.
f1 = diff(f)
f1(x) =
fplot(f1)
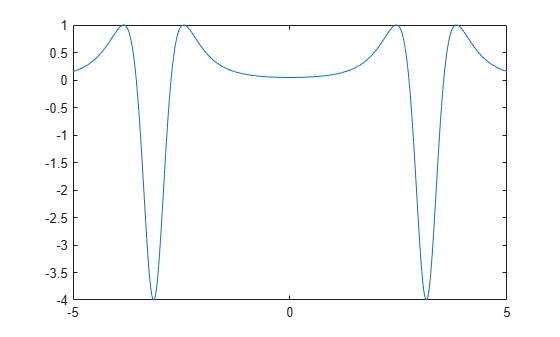
diff can also find the derivative. Here is the second derivative.
f2 = diff(f,2)
f2(x) =
fplot(f2)
int integrates functions of symbolic variables. The following is an attempt to retrieve the original function by integrating the second derivative twice.
g = int(int(f2))
g(x) =
fplot(g)
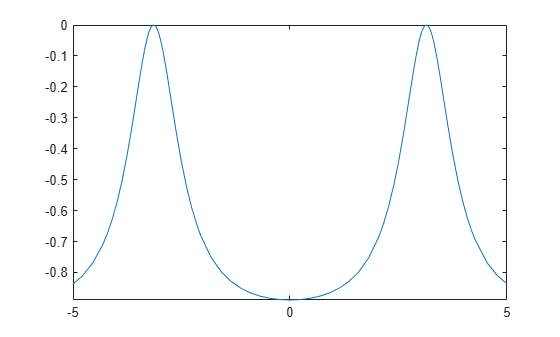
At first glance, the plots for and look the same. Look carefully, however, at their formulas and their ranges on the y-axis.
subplot(1,2,1)
fplot(f)
subplot(1,2,2)
fplot(g)
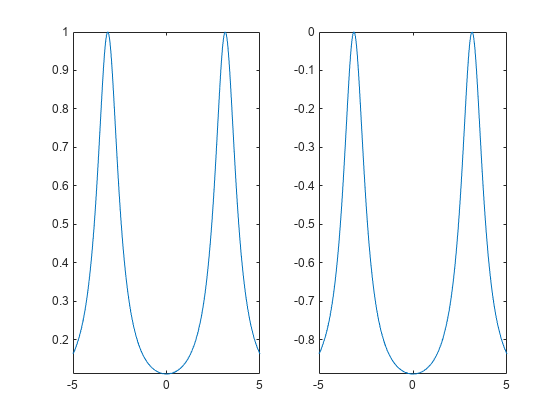
is the difference between and . It has a complicated formula, but its graph looks like a constant.
e = f - g
e(x) =
To show that the difference really is a constant, simplify the equation. This confirms that the difference between them really is a constant.
e = simplify(e)
e(x) =