Specify Custom Beamforming Weights with TGay Channel Model
This example shows how to specify custom beamforming weights in a TGay channel model by calculating transmit and receive array weights based on scenario geometry and scanning information.
Create Channel
Create a wlanTGayChannel object and set the location of transmit and receive arrays.
tgay = wlanTGayChannel;
tgay.Environment = "Open area hotspot";
tgay.CarrierFrequency = 60e9;
tgay.TransmitArrayPosition = [0; 0; 10]; % [x; y; z] meters
tgay.ReceiveArrayPosition = [10; 10; 10];
tgay.RandomStream = "mt19937ar with seed"; % Use a fixed random seed
tgay.Seed = 1;
tgay.IntraClusterRays = false;
Define a 4-by-4 transmit and receive antenna array. The first element of Size specifies the number of elements along the y-axis. The second element of Size specifies the number of elements along the x-axis.
c = physconst("LightSpeed");
lambda = c/tgay.CarrierFrequency;
tgay.TransmitArray = wlanURAConfig(Size=[4 4],ElementSpacing=(lambda/2)*[1 1]);
tgay.ReceiveArray = wlanURAConfig(Size=[4 4],ElementSpacing=(lambda/2)*[1 1]);
Disable channel impulse response normalization to compare the response with different beamforming weights.
tgay.NormalizeImpulseResponses = false;
Specify custom beamforming and default beamforming weights of the required size.
tgay.BeamformingMethod = "Custom";
tgay.TransmitBeamformingVectors = 0.5*ones(prod(tgay.TransmitArray.Size),1);
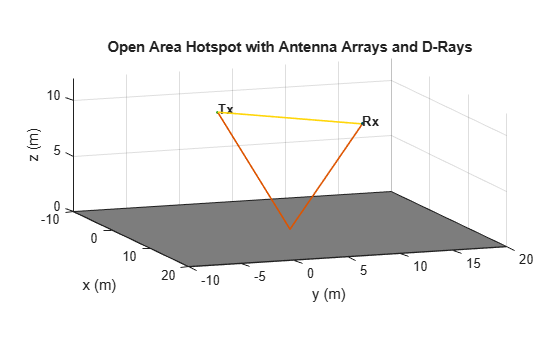
tgay.ReceiveBeamformingVectors = 0.5*ones(prod(tgay.ReceiveArray.Size),1);Show the scenario.
showEnvironment(tgay);
view(70,10);
Orientate Arrays
The azimuth angles used within wlanTGayChannel are relative to the y-axis. Therefore, orientate the arrays so that the array is along the y-axis. This allows you to use the angles of departure and arrival of the rays from the channel to generate beamforming weights without needing to convert angles from a local coordinate system to a global coordinate system.
By default the normal to the antenna array points along the z-axis.
hPlotArrays(tgay,"Tx");
view(70,10);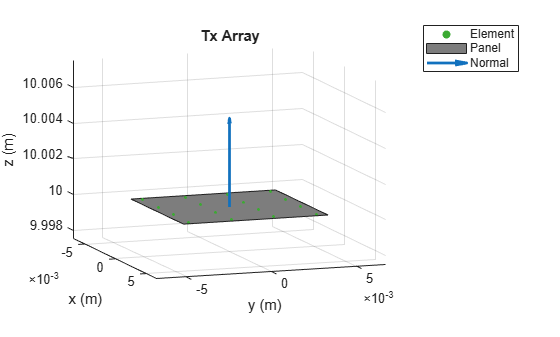
hPlotArrays(tgay,"Rx");
view(70,10);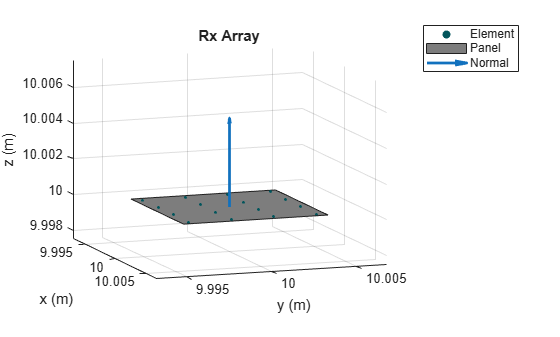
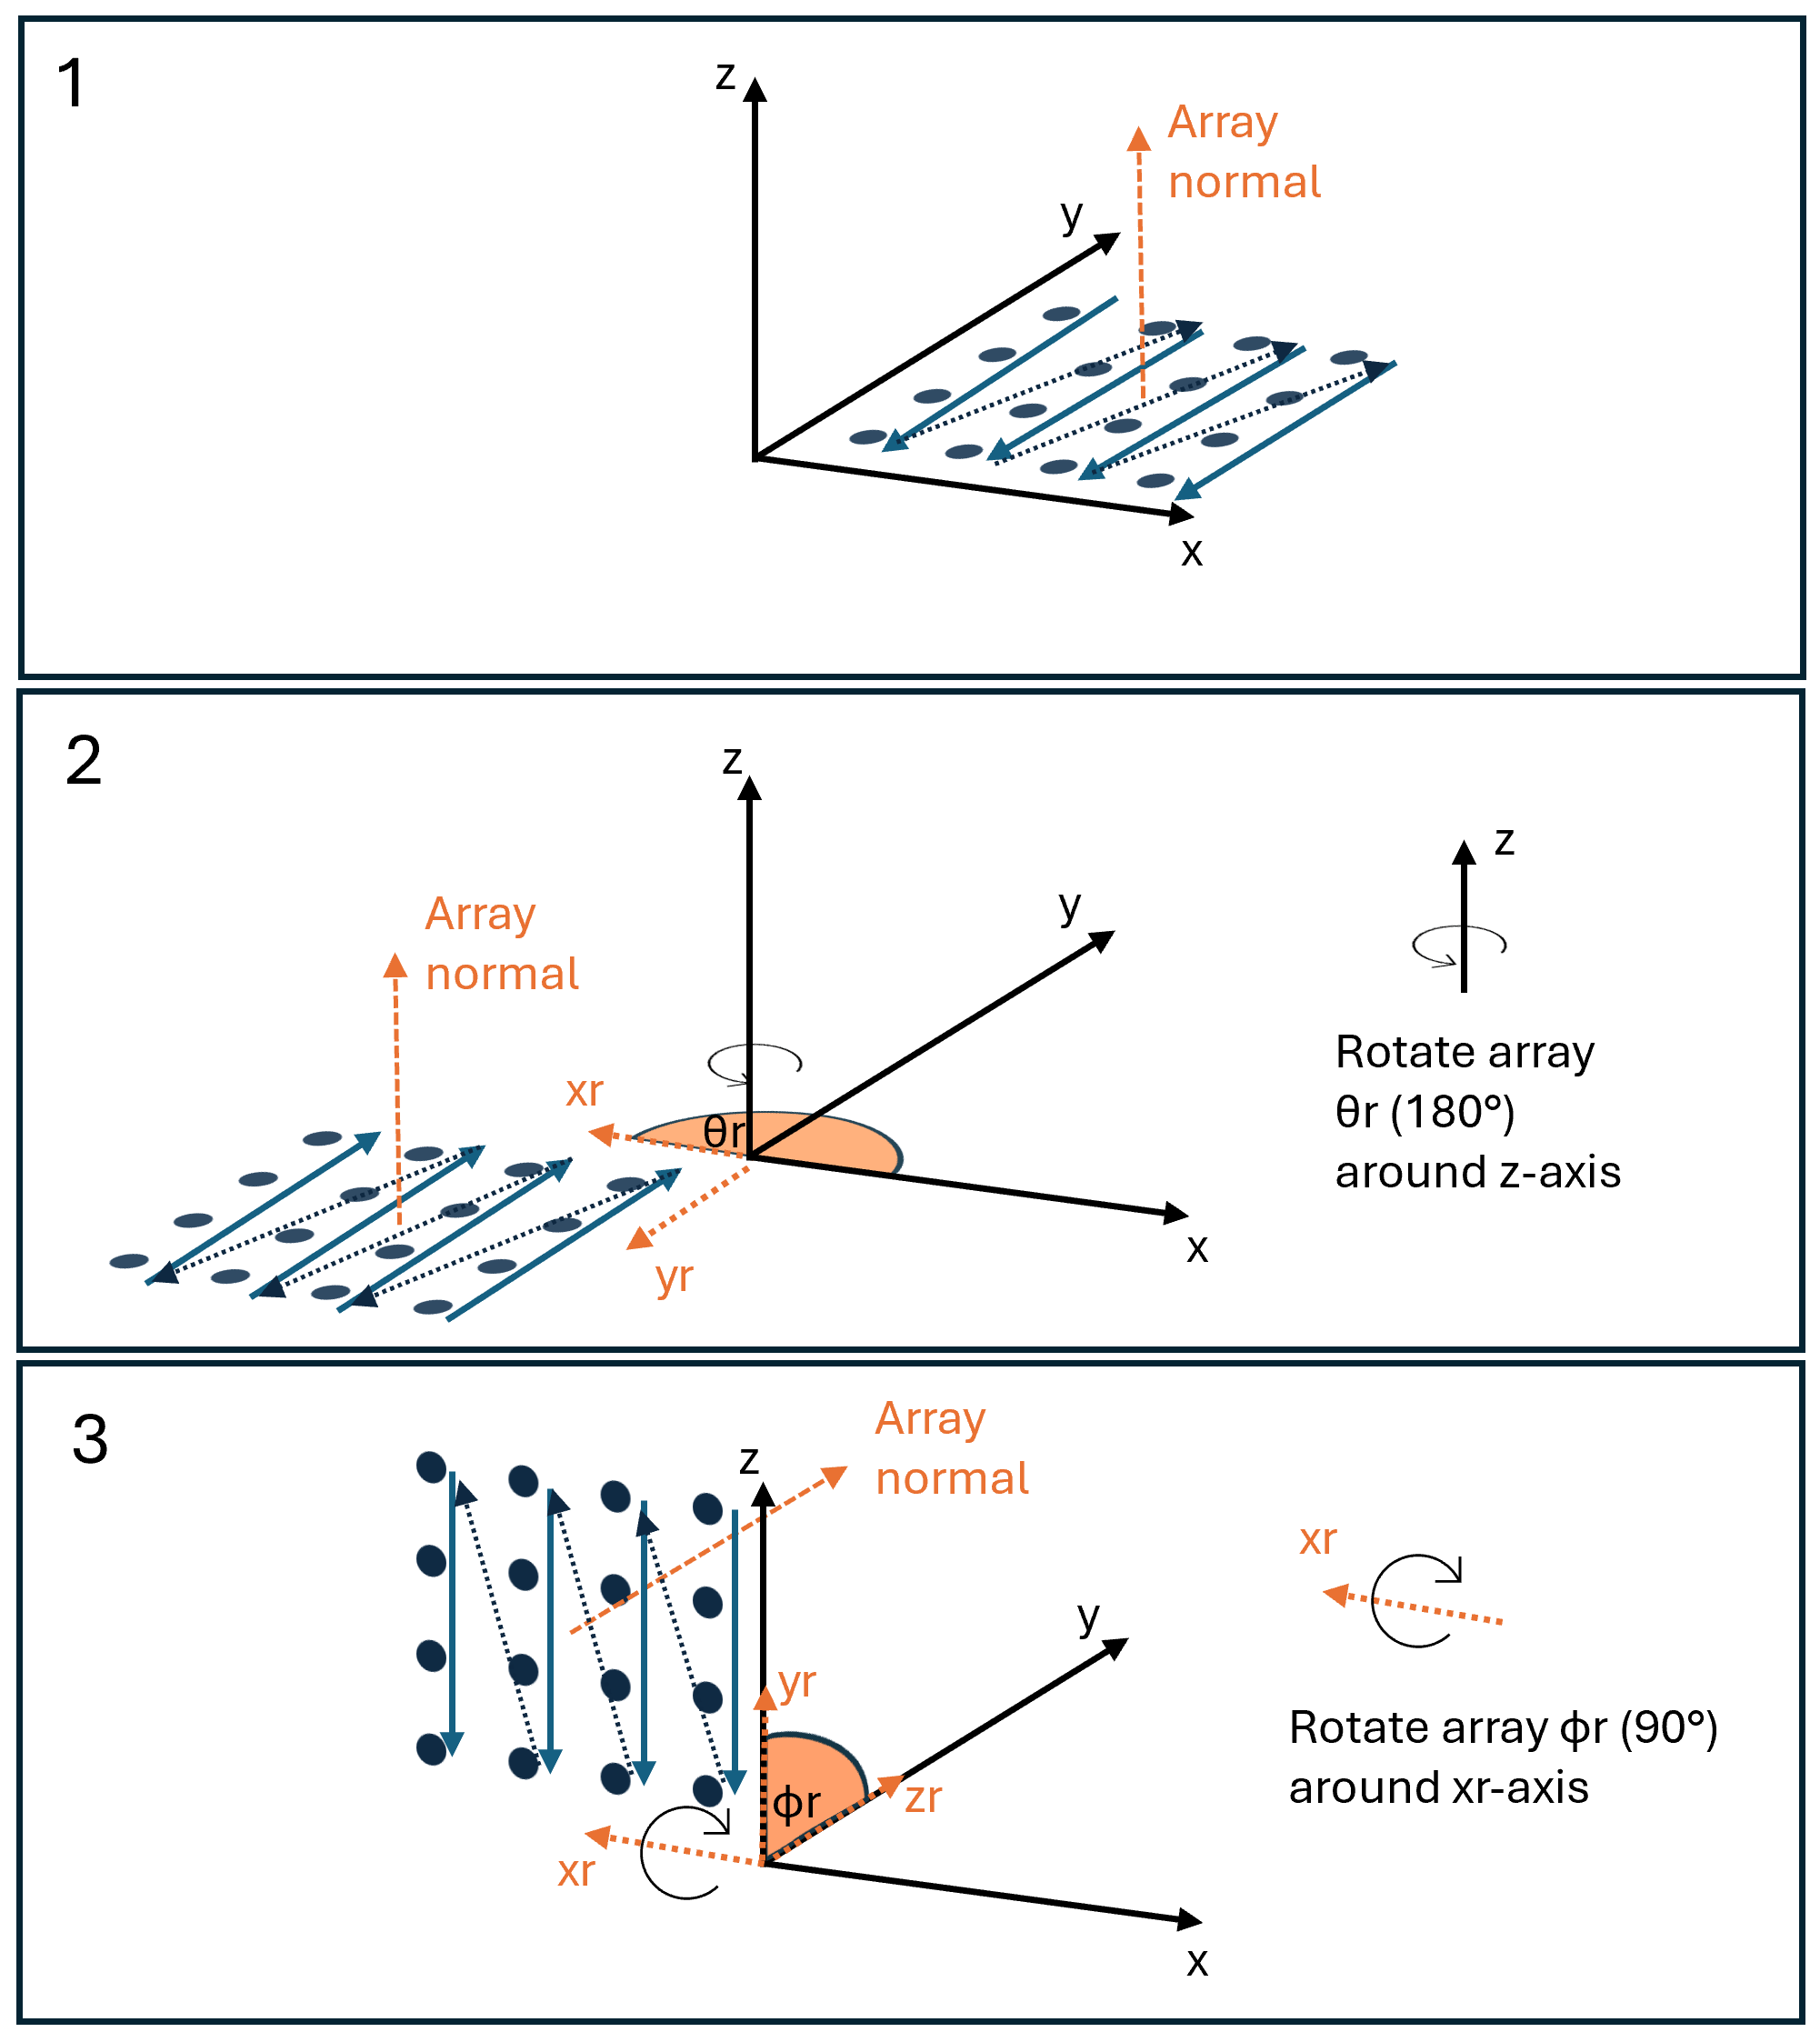
For each array:
Rotate the array 180 degrees around the z-axis to form new rotated axes, denoted xr and yr.
Rotate 90 degrees around the xr-axis so the array normal is pointing along the y-axis (negative to positive).
This diagram shows the rotations of the transmit array and the order in which the beamforming weights in the TransmitBeamformingVector property are applied to the array elements. For more information about rotations, refer to Maltsev, A., et al.. Channel Models for 60GHz WLAN Systems. IEEE 802.11-09/0334r8, May 2010, Section 6.3.3.
tgay.TransmitArrayOrientation = [180; 90; 0];
hPlotArrays(tgay,"Tx"); view(70,10);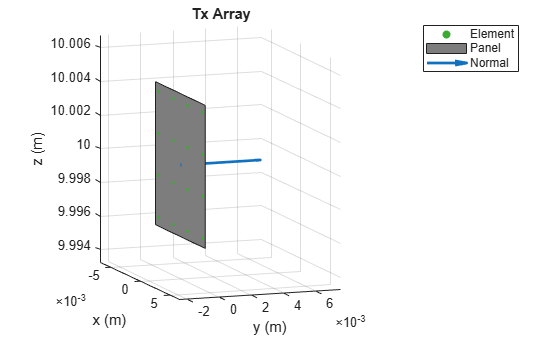
tgay.ReceiveArrayOrientation = [180; 90; 0];
hPlotArrays(tgay,"Rx"); view(70,10);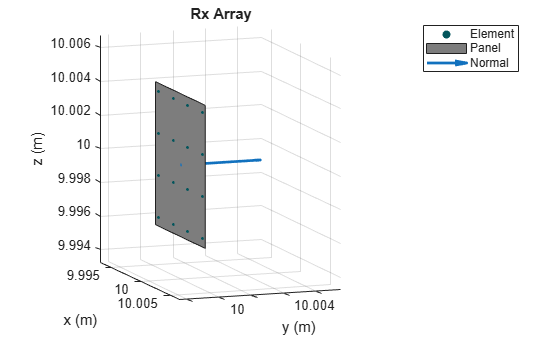
Apply Beamforming Weights to Receive Array
Use Phased Array System Toolbox™ objects to calculate steering vectors for a uniform rectangular array. This matches the type of array you configured in the tgay channel object. Set the ArrayNormal property to "y" to match the array orientation set in the tgay channel model object.
rxArray = phased.URA;
rxArray.Size = tgay.ReceiveArray.Size;
rxArray.ElementSpacing = tgay.ReceiveArray.ElementSpacing(1);
rxArray.ArrayNormal = "y";
steeringVector = phased.SteeringVector(SensorArray=rxArray);
Set receive array beamforming weights to point to the transmitter. Use the angle of arrival (AoA) of the line of sight (LoS) ray.
tgay(1); % Pass dummy data to generate rays
channelInfo = info(tgay); % Get channel info
losIdx = 1; % First element of AoA or AoD is LoS ray
aoa = [channelInfo.AnglesOfArrival(1,losIdx); channelInfo.AnglesOfArrival(2,losIdx)]; % [Azimuth; Elevation]
weights = steeringVector(tgay.CarrierFrequency,aoa);
tgay.ReceiveBeamformingVectors = conj(weights);
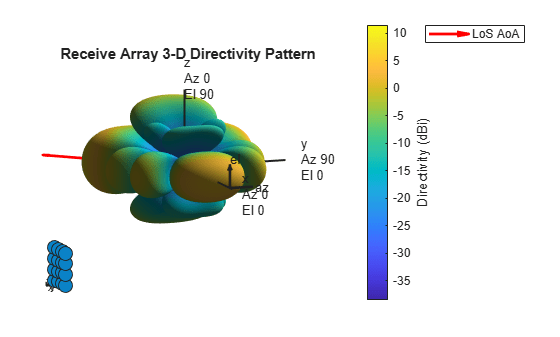
Show the receive array pattern with the steering weights and the LoS direction.
figure;
pattern(rxArray,tgay.CarrierFrequency,-180:180,-90:90,Weights=weights,ShowArray=true);
title("Receive Array 3-D Directivity Pattern")
view(70,10);
hold on;
[x,y,z] = sph2cart(deg2rad(aoa(1)),deg2rad(aoa(2)),1);
hq = quiver3(0,0,0,80*x,80*y,80*z,"r",LineWidth=2);
legend(hq,"LoS AoA")
Apply Beamforming Weights to Transmit Array
Set transmit array beamforming weights to point to the receiver. Use the angle of departure (AoD) of the LoS ray.
txArray = phased.URA;
txArray.Size = tgay.TransmitArray.Size;
txArray.ElementSpacing = tgay.TransmitArray.ElementSpacing(1);
txArray.ArrayNormal = "y";
steeringVector = phased.SteeringVector(SensorArray=txArray);

aod = [channelInfo.AnglesOfDeparture(1,losIdx); channelInfo.AnglesOfDeparture(2,losIdx)]; % [Azimuth; Elevation]
weights = steeringVector(tgay.CarrierFrequency,aod);
tgay.TransmitBeamformingVectors = conj(weights);
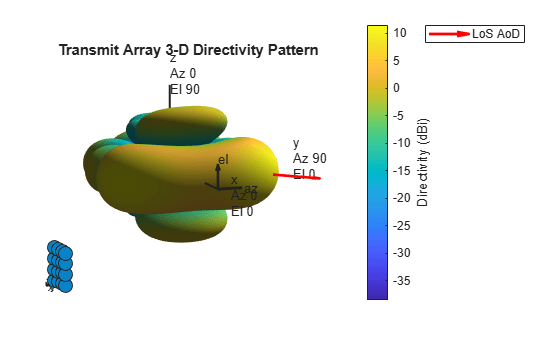
Show transmit array pattern with steering weights.
figure;
pattern(txArray,tgay.CarrierFrequency,-180:180,-90:90,Weights=weights,ShowArray=true);
title("Transmit Array 3-D Directivity Pattern")
view(70,10);
hold on;
[x,y,z] = sph2cart(deg2rad(aod(1)),deg2rad(aod(2)),1);
hq = quiver3(0,0,0,80*x,80*y,80*z,"r",LineWidth=2);
legend(hq,"LoS AoD")
Previously you used the known LoS angle of departure to calculate the transmitter beamforming weights. In this section, scan over different azimuths and elevations and evaluate the power of the channel impulse response (CIR) to find the optimum weights.
For each azimuth and elevation, generate a steering vector, set this vector as the transmitter beamforming weights, and generate a CIR.
x = 1; % Sent impulse through channel to generate a 1-sample CIR
azAngles = 0:5:180;
elAngles = -90:5:90;
cir = [];
i = 1;
for az = azAngles
    for el = elAngles
        % Generate a steering vector for an azimuth and elevation
        weights = steeringVector(tgay.CarrierFrequency,[az; el]);

        % Apply beamforming weights and generate channel impulse response
        tgay.TransmitBeamformingVectors = conj(weights);
        [~,cir(i,:)] = tgay(x); %#ok<SAGROW>
        i = i+1;
    end
end
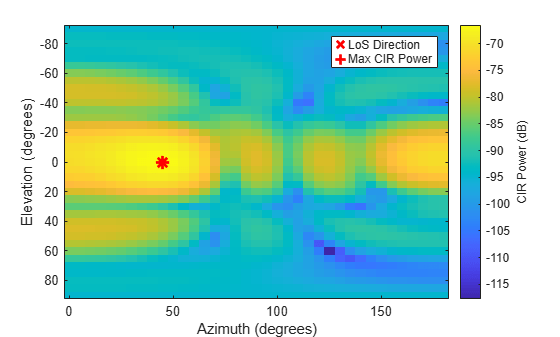
Plot the power of the CIR for each azimuth and elevation steering vector.
cirPower = pow2db(sum(abs(cir).^2,2));
cirPower = reshape(cirPower,numel(elAngles),numel(azAngles));
figure; imagesc(azAngles,elAngles,cirPower);
c = colorbar;
c.Label.String = "CIR Power (dB)";
xlabel("Azimuth (degrees)");
ylabel("Elevation (degrees)");
Show the AoD between the transmitter and receiver on the plot.
hold on;
plot(aod(1),aod(2),"xr",MarkerSize=10,LineWidth=2);
Show the azimuth and elevation corresponding to the most powerful channel impulse response.
[maxPower,maxIdx] = max(cirPower,[],"all");
[maxElIdx,maxAzIdx] = ind2sub(size(cirPower),maxIdx);
plot(azAngles(maxAzIdx),elAngles(maxElIdx),"+r",MarkerSize=10,LineWidth=2);
legend("LoS Direction","Max CIR Power");