"Attempt to modify the tree during an update traversal"
That's some new error checking that was added in R2014b. It's detecting a case where code that's running during a drawnow is...
10 years ago | 0
Help with MESH command
Did you mean something like this? [r,theta] = meshgrid(linspace(0,1,30),linspace(0,2*pi,30)); x = r.*cos(theta); y = ...
10 years ago | 0
| accepted
How to generate a point cloud in 3D?
This might be a good starting point: [x,y,z] = ndgrid(1:5:100,1:5:100,1:5:100); scatter3(x(:),y(:),z(:),'.') <</matla...
10 years ago | 2
| accepted
surf(Z) Z= 11x9 double produces a 10x8 surface
When you create a surface, each value in your matrix becomes one of the vertices of the surface. Since the faces of the surface ...
10 years ago | 0
| accepted
Want to plot a single point on an ezmesh plot
The ezmeshc function leaves the limits in manual mode. This means that if mins or fval are outside the limits, they won't be str...
10 years ago | 0
I wanna make graph theory graphs in matlab. what commonds will be use for graph theory?
In R2015b, a new <http://www.mathworks.com/help/matlab/ref/graph.html graph function> was added for exactly this purpose.
10 years ago | 0
| accepted
How to assign gradual color to a 3d line based on values of another vector
Unfortunately the line object that plot and plot3 create can't do color data interpolation. Several of the other objects can. Th...
10 years ago | 7
| accepted
Coming up with a Unique Matlab Graphics / Plotting Solution
You've got some good ideas above, but I'd like to mention one thing that you're going to have to worry about. When you've got a ...
10 years ago | 0
How to check if handle is to a deleted axes?
A couple of choices. h = plot(1:10); delete(h) isvalid(h) isgraphics(h) Either of those will return false for a...
10 years ago | 5
| accepted
Published
Memory Consumption
Today we're going to look at how MATLAB Graphics uses memory. First we need a way to tell how much memory MATLAB is...
10 years ago
How to control the next color?
If you're using scatter without a CData argument (4th arg), then it's using the ColorOrder property of the axes. You can find so...
10 years ago | 0
How to plot the real function not just points in matlab?
That's all true, but we should probably stop to tell Karim that MATLAB does have a lot of tools for evaluating points on some of...
10 years ago | 0
| accepted
3d graphics rendering very slow
It's hard to know without more details. Graphics performance is fairly complicated because it involves balancing several differe...
10 years ago | 0
Annotation position driving me mad!! changing the position values won't work...
What did you expect this to do? And how does that differ from what it is doing? Here's a simplified version of your code: ...
10 years ago | 0
How can I make a moving graph that shows new data as it comes in?
You're probably going to want to use the <http://www.mathworks.com/help/matlab/ref/animatedline.html animatedline object>. I wou...
10 years ago | 0
| accepted
Increase the plotting performance in the MATLAB level (drawmode/ optimizing rendering/ down sampling etc)
There isn't a "one size fits all" answer for this. We'd need to know more about what you're doing. The first step is to use ...
10 years ago | 0
Published
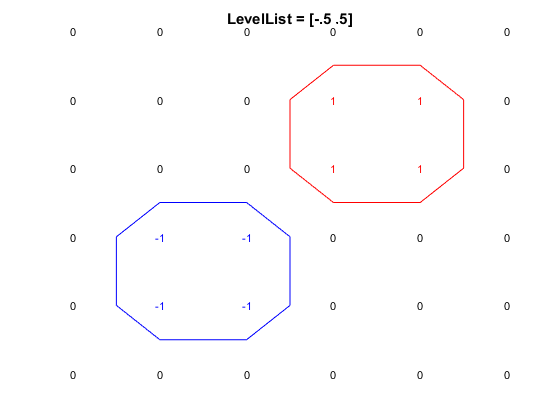
On The Edge
In an earlier post, we discussed how the contour functions interpolate between values. Another important issue is how the...
10 years ago
Matlab Cylinder create and make a joint with another cylinder
It's a bit verbose, but the simplest way is probably nested <http://www.mathworks.com/help/matlab/ref/hgtransform.html hgtransfo...
10 years ago | 0
How to create a ezcontour in cylindrical domain?
Can't you just add the definition of R in terms of X & Y? syms x y r = sqrt(x^2+y^2); t = -r^2 + 1; ezcontour(t) ...
10 years ago | 0
2015b ghostscript not found - ps2pdf multi-page ps to pdf
We stopped shipping Ghostscript with MATLAB because nothing in MATLAB uses it any longer. If you're still using it, you can down...
10 years ago | 1
| accepted
How can i draw a simultaneous animated plot?
Basically you just want one loop with both plotting commands in it. The tricky part of that is that you're currently depending o...
10 years ago | 0
realmax is really real max, but is realmin really real min?
I think that you're seeing the <https://en.wikipedia.org/wiki/Denormal_number denorms>. They allow you to get closer to 0, but a...
10 years ago | 3
| accepted
How do i display a kannada unicode letters into its ASCII value using matlab code
Why do you want to convert to ASCII? MATLAB's native character representation is Unicode, not ASCII. You can display the cha...
10 years ago | 2
| accepted
3d plot-surf
You have a couple of options. We were just discussing them in <http://www.mathworks.com/matlabcentral/answers/247422-matlab-2-d-...
10 years ago | 0
| accepted
How can I delete previous circles while circle is moving ?
Ah, good question! You've got several options here. * There's the <http://www.mathworks.com/help/matlab/ref/cla.html cla fu...
10 years ago | 0
How to colour code polygons by area?
It's actually pretty easy to do with the <http://www.mathworks.com/help/matlab/ref/polyarea.html polyarea function>. Let's st...
10 years ago | 1
| accepted
Surf plot of edges, smooth on one diagonal, spiky on the other
What you're seeing is the interpolation scheme I described in <http://blogs.mathworks.com/graphics/2014/11/18/what-is-a-surface/...
10 years ago | 0
How can I make a filled contour plot with data that has x,y coordinates and values corresponding to each point?
We were just talking about that case on <http://www.mathworks.com/matlabcentral/answers/247422-matlab-2-d-color-plot-without-ima...
10 years ago | 0
Set y-axis as vertical when plotting in 3d
Perhaps you just want to set the <http://www.mathworks.com/help/matlab/ref/camup.html CameraUpVector> ? xlabel('X') ylab...
10 years ago | 2
| accepted
i can't plot my function
That link in the error message should have taken you to <http://www.mathworks.com/help/matlab/creating_plots/resolving-low-level...
10 years ago | 0