Automatic line selection bug
Ensure that your mouse button isn't stuck. I haven't seen this issue but if it continues to occur after closing and reopening M...
4 months ago | 0
Cannot Open any MLAPP with axes
This appears to be the same issue as in the thread Saurabh mentioned. If you want to try to fix this yourself I suggest you cre...
4 months ago | 1
Where can I get a matlab coffee cup?
Check out the new MathWorks Merch Shop: https://mathworksmerch.com/ Announcement: https://blogs.mathworks.com/community/2024/11...
4 months ago | 4
when I move the plot, the text is not displayed outside the plot itself
When you create the text labels, set clipping to on. text(___,'Clipping','on')
4 months ago | 0
| accepted
Is there any way to add a set of random punctual z values labels inside the plot using a contourf x, y, z command?
Add a set of random z value labels inside a contourf plot This demo shows the following. Define x (vector), y (vector), and z...
4 months ago | 0
| accepted
Serial: Real-time plotting and storaging streaming data from Arduino slowing down badly over time
Calling plot(__) with hold on in a loop is inefficient. Every time new points are added to the axes, new line objects are creat...
4 months ago | 0
Published
Narrow down your legends with IconColumnWidth
Guest Writer: Afiq Azaibi Afiq Azaibi is back to tell us about a new feature in R2024b that controls the...
5 months ago

Violin plot has tails that go beyond real data
The important concept to understand is that violin plots show a visual estimate of the data’s distribution beyond the observed v...
5 months ago | 0
How to creat grouped violin plot?
MATLAB R2024b introduces a new violinplot with a grouping option. data = random(makedist('Weibull'),1000,8); xgroup = catego...
5 months ago | 0
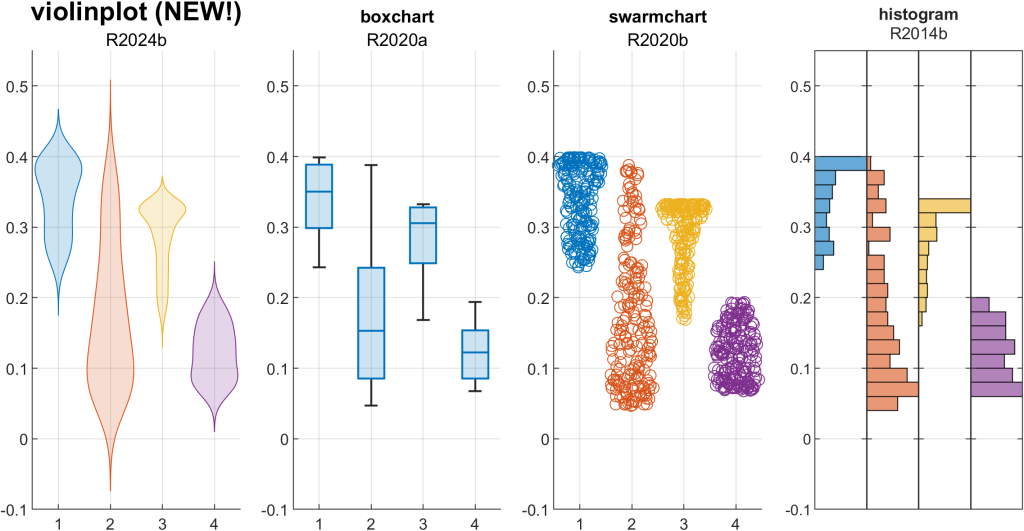
how to do violin plot in matlab
MATLAB now has a violinplot, introduced in R2024b. See also swarmchart tiledlayout(3,1) violinplot(nexttile,rand(20,3).*[.8 ...
5 months ago | 0
How to create an external plot in live editor?
f = figure(); plot(magic(5)) f.Visible = 'on'; % This sets the external figure visibility to on alternatively, use uifigure...
5 months ago | 0
Specify "plot box" position for tiled layout
> How can I set the postion of the "plot box" that is made up from the three tiled plots? The position property for axes in a T...
5 months ago | 0
| accepted
multiple 3D plane plotting
Starting in R2024b, you can use the constantplane function to generate planes based on their vector normals. Using Matt J's demo...
5 months ago | 1
how to draw a plane?
Starting in MATLAB R2024b, you can use constantplane to create a 2D plane in 3D axes. However, unlike surfaces and patches, the...
5 months ago | 0
plotting a plane in three dimensions including data points
Starting in R2024b, use the constantplane function to plot a 2D plane in 3D axes. The ConstantPlane is defined by its normal v...
5 months ago | 0
What figure properties does graymon sets?
In case anyone is still looking to flip between gray and colored figured, exportgraphics has a colorspace property that can be s...
5 months ago | 0
I want to change the background value of figure to white.
Set the figure's color using the figure's Color property. set(gcf,'Color','white') Or set the color upon creation of the figur...
5 months ago | 1
| accepted
Published
Plotting a New Course: A Grown-Up compassplot
Guest Writer: Abby Skofield Today's R2024b feature highlight is written by Abby Skofield, a developer on the...
5 months ago

How to add a 2D plot to an existing 3D plot by sharing the same axes?
This is challenging. The reason it's challenging is because camera properties are set relative to a point in an axes, not relat...
6 months ago | 3
| accepted
Published
R2024b release: What’s new in Graphics and App Building?
Two of my favorite times of the year are September and March, when the landscape transforms beautifully in my area of the...
6 months ago
first time use Histogram, need help
In MATLAB, I recommend using the histogram function. histogram('Categories',Categories,'BinCounts',counts) x = reshape([0.29:0...
6 months ago | 1
Add title to one row of a subplot
Instead of using subplot, I recommend using tiledlayout which supports nested layouts and global titles. Follow these instructi...
6 months ago | 0
dock graphics window size
To set an existing figure's position back to the factory default, set(fig,'Position','factory') Note that set() must be used ...
6 months ago | 0
Why is my Mixed ANOVA including the intercept as an interaction term?
You can remove the interaction term by including "-1" in the model spec (doc). I also included terms for Congruency and Target i...
7 months ago | 1
Variables window doesn't work after undocking in R2023b
Hi Kim, please contact tech support and include your instructions above how to reproduce the problem.
7 months ago | 0
| accepted
exportgraphics causing strange messages in terminal only for Compiled version of App
This issue was fixed in R2024a. The problem occurred when setting append to true in exportgraphics.
7 months ago | 2
| accepted
Fix to frequent "Application not responding" for MATLAB on the Mac
Thank you for sharing your experience, @Daniel Dolan and others. I've consulted with MathWorks developers who work on this infr...
7 months ago | 0
Return cursor to commandline after plotting
I'm familiar with this issue. Please consider reporting your thoughts on the matter to Tech Support. The best way to do that is...
7 months ago | 0
| accepted
When will the transition from Java to Javascript be complete?
Thanks for your questions and curiosity about the JavaScript transition. I highly recommend that you try out the beta version of...
7 months ago | 4
| accepted
Vertical blank space in tiledlayout compact
> As you can see there is some vertical unnecessary space between the two horizontal stacks of plots. I would like to reduce it ...
7 months ago | 1