Introduction and Data Annotation | AI Techniques for ECG Classification, Part 1
From the series: AI Techniques for ECG Classification
Learn how you can use the Signal Labeler app to interactively annotate ECG signals at a class level, region level, or sample level. Once the signals are prepared and annotated, you can use downstream workflows such as machine learning or deep learning techniques to build predictive models for classification.
Published: 28 Jan 2021
Hello. Welcome to the part one of the video series on developing AI models for biomedical ECG signals. My name is Akhilish, and I'm a senior application engineer in the medical industry at MathWorks. And today I would be talking about a little bit of introduction, of building AI models, and we'll also cover a data annotation for signals in this part one of the series.
So applications of AI, so in the biomedical industry, we see that the AI has been used in multifarious fashion. So to give an example, the team at the University of Texas, Austin took the brain signals using MEG, converted them into time frequency images by scalograms, and trained deep learning models to infer those brain signals and decode them in speech commands.
Another application is at Battelle. The use of the brain signals again, but this time they had this device to convert brain signals into movements which would aid and facilitate hand movement restoration for paralyzed patients.
So the question is, why do we want to use MathWorks? So recently, in a Gartner's Magic quadrant for data science and machine learning platforms, MathWorks was recognized as a leader. And this is because we have the ability to not only build AI models, but then also work with the entire pipeline, which entails preparing the data, designing the system, and deploying those AI models on edge devices as well as enterprise solutions for end-to-end production. We also at MathWorks have the complex tools which you would need when you work with signals or images, so maybe, in controlled applications to facilitate the building of AI models.
So let's go to the basic question. What is artificial intelligence? So artificial intelligence is the ability of a digital computer to perform tasks which is associated with intelligent beings like humans. Machine learning is a subset where we learn tasks from data without relying on a predetermined equation or model. Deep learning is a subset of machine learning in which a model learns to perform tasks directly from images, text, or sound using neural network architecture.
So usually a question arises, which direction to go for AI when in biomedical application? Now, it depends. If you have a lot of data, and you want some quick results, then you might want to try out the deep learning approach for CNNs or LSTMs, which will give you a much faster result, maybe, or they cannot be as accurate. If you have some time available, you might also want to try out some manual feature extraction from your data set and train machine learning models.
Now, if you do not have enough data, and we also offer advanced signal processing and image processing methods like wavelength scattering filter banks to extract features from the data which results in more higher fidelity, more with machine learning as well as deep learning. And, at the same time, if you do not have enough data and then you have sufficient time, you can actually really build simulation model of a physiological system and artificially generate data to augment with your existing data, and then train the deep learning or machine learning model.
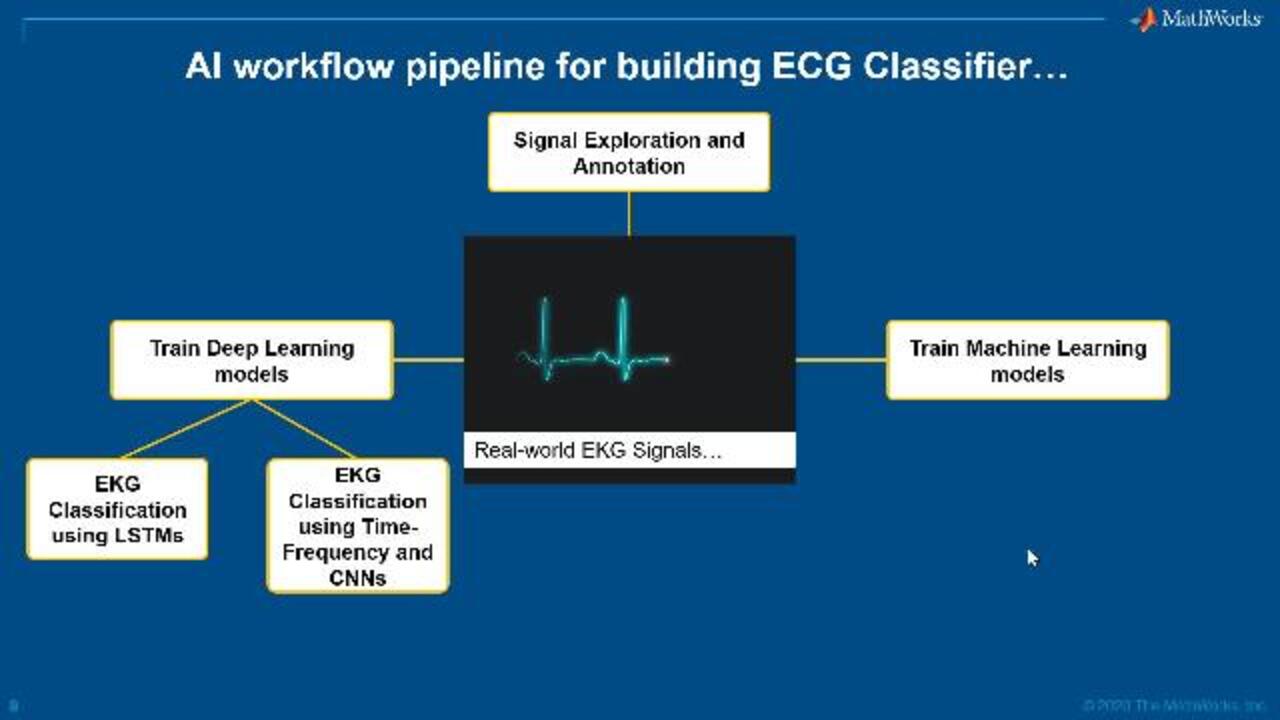
So the AI workflow for pipeline for building ECG classifier can entail several steps. Step one is what we'll cover in this particular video about signal exploration and annotation, but then we would go ahead in the video number 3 and 4 to explore how do we train deep learning models with CNNs and LSTMs. In video number 2, we will see how to train machine learning model using automated feature extraction. And finally, in part 5 of this video series, we will see how you can automatically convert your signal processing plus deep learning classification into a CUDA code to deploy on IoT platforms, such as NVIDIA Jetson.
The ECG data source which we'll work today in this video, as well as the subsequent videos are obtained from the PhysioNet challenge. And we have 162 EKG records representing three different classes, which are the arrhythmia, congestive heart failure, and cardiac and normal sinus rhythm. Each record have 65,000 samples, which is sampled at the rate of 128 hertz.
So let's go and see the AI workflow, what it entails. It usually has three steps. The step one is the data preparation, which involves maybe some preprocessing and labeling of the signals because the labeling is an important step. And I must emphasize that sometimes our signals-- in this case, we're just working with 162 signals-- but sometimes we might be working with thousands and thousands of signals which are very well known with a lot of different samples. So labeling can consume a lot of time in this AI workflow.
The second step is the training the model where we actually build machine learning or deep learning models. And this also involves hardware-accelerated training on cloud or even on local GPU. And once we have the final model, you go ahead and deploy it on a microcontroller to do some real time classification, or edge deployment on an embedded GPU. Or maybe even deployed on an enterprise level, where we have an application running on apps on cell phones which requires EKG data live from patients using some hardware devices, does the classification on the app and all those apps are also connected in the cloud with the hospital systems, and they are constantly communicating the health of the patient.
Now all these three steps does involve a little bit of preparation and refinement until we get to a final product, which is the ECG classifier in this case. So let's go into the preparation step. And I would like to introduce at this point an app in MATLAB which is called the signal labeling, which allows us to interactively annotate signals and reduces a lot of time which is spent otherwise on labelling on the signal.
So let's go to MATLAB at this point. So this is a MATLAB session, and I have loaded a single ECG record in my workspace. And how I open that signal label app is through my Apps tab. I can navigate to the Signal Processing and Communications section, and then I have this app Signal Labeler.
I can import this data from my workspace, but then I can also load it directly from a file in my workspace. I have this normal sample. Let's go ahead and import it. Now, I can import in multiple samples, but right now, just let's work with single signal. And once I have that, I can go ahead and plot it. So this is my normal rhythm. Let's go ahead and start adding some definitions.
Now, we can label three aspects. One of the attributes is labeling the entire signal, which is what we will be working with in our subsequent video. But then we can also label the region of interest or maybe a point. So let's go in and define the entire attributes. So one is my normal rhythm, and I'll define ARR, which is my arrhythmia, and then I'll also defined my CHF, which is our heart failure. And these are the three attributes.
Now notice that, right now, we have assigned labels to the signal, but let's go ahead and start labeling. I'll say Label Attribute, and NSR for the signal is true, but ARR is false and CHF is false as well. Now, for our application, maybe we do not need the false information for CHF and ARR, but in some applications, one signal can have more than one label.
Let's go ahead and find some more labels as region of interest. So for instance, if we are building a biomedical application to only classify the QRS complex for instance, then we can certainly do that. So this QRS complex is there, and I'll go ahead and draw labels. And for drawing the labels, I can just interactively select where my points are, the QRS column which corresponds to QRS complex. And just like that, I have this label over here.
Similarly, I can find more labels like this, but at the same time now I can also add another definition. Suppose if I want some points, then I can say, for instance, in my application I'm working with Rpeaks and I want to label them, then I can certainly do that. But let's go ahead and label the Rpeaks first.
So this is Rpeaks perfect. And I can have another Rpeak, maybe, let's say this one, and maybe I'll just do another one over here. There we go.
So now you see that, for this one signal, I have all these attribute labels. I have the x-axis location for my QRS attributes, and then for Rpeaks, we have the following three labels. And once I have done all this labeling, I can export them either to a workspace where I can save it as a file, as a .mat file which I can reimport later for my training purposes.
Now if you would like to check more about the Signal Labeler tool, please do visit our documentation page, Signal Labeler in our Signal Processing Tool Box. And then you can go over a few examples on how to use this app, and then we have some related examples talking about using this Labeler app effectively.


Select a Web Site
Choose a web site to get translated content where available and see local events and offers. Based on your location, we recommend that you select: United States.
You can also select a web site from the following list
Americas
- América Latina (Español)
- Canada (English)
- United States (English)
Europe
- Belgium (English)
- Denmark (English)
- Deutschland (Deutsch)
- España (Español)
- Finland (English)
- France (Français)
- Ireland (English)
- Italia (Italiano)
- Luxembourg (English)
- Netherlands (English)
- Norway (English)
- Österreich (Deutsch)
- Portugal (English)
- Sweden (English)
- Switzerland
- United Kingdom (English)