ANA's Predictive Maintenance Challenge: Replace Aircraft Parts Before They Break
Sadanari Shigetomi, All Nippon Airways Co., Ltd.
Naoya Kaido, All Nippon Airways Co., Ltd.
All Nippon Airways Group started its air transport business in 1952 and celebrated its 70th anniversary in 2022. ANA Maintenance Center is working on predictive maintenance for aircraft maintenance. We detect failure signs of various aircraft components based on sensor data collected during flights, aiming to improve safety and on-time performance. To perform predictive maintenance, it is necessary to identify features to predict failures from sensor data. The ANA Maintenance Center leverages the deep domain knowledge of the maintenance crew and sensor data from more than 20 thousand flights around the world. The sensor data includes external factors, such as weather conditions, flight path, and number of passengers. In this talk, see how we used machine learning with MATLAB® to test hypotheses and create machine learning models. We successfully identified robust features that enabled early failure detection of the cabin air compressor (CAC), one of the main air conditioning components. The preprocessing pipeline and the trained model were integrated into an existing system using MATLAB Compiler™ for daily inspection.
Highlights:
- Predictive maintenance for aircraft maintenance
- Hypothesis verification of failure-identifying features using domain knowledge and field data
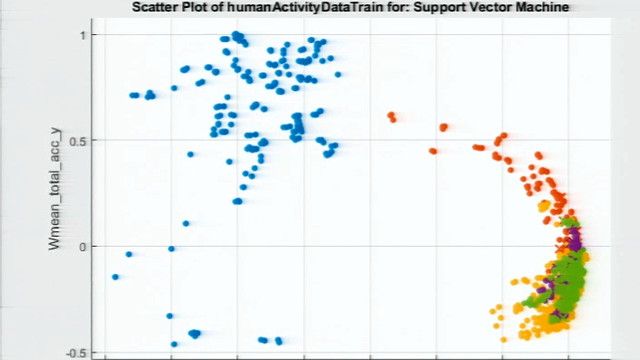
- A case study on detecting the deterioration of aircraft components using a neural network
Published: 5 May 2023
Hello, everyone, and welcome to our presentation. I'm Sadanari Shigetomi, a supervisor from component operation management and maintenance of ANA. I'm a data analyst in charge of condition monitoring of aircraft. Naoya-san, I'm Naoya Kaido, a supervisor from the same department with Sadanari-san. I'm in charge of DPR management and technical support of components.
OK, today, we would like to present our challenge in predictive maintenance of commercial aircraft, specifically in detecting anomalies in machine accessories using the MATLAB environment. So here is the agenda of our presentation today. First, let me introduce our company.
ANA, or All Nippon Airways, is a Japanese full-service carrier headquartered in Tokyo and one of the Star Alliance members. We celebrated our 70th anniversary last year. The ANA group has over 40,000 employees. And our main business is Schedule L transportation. ANA operates domestic flights in Japan as well as international flights to Asia, Europe, North America, and Australia.
As of last year, we have 227 passenger aircraft and 11 cargo aircraft ranging from small regional aircraft to the world's largest commercial aircraft, the Airbus A380. And we are the launch customer or Boeing 787 Dreamliner. And we currently have the largest fleet of Boeing 787 in the world.
OK, so let us discuss why operators are trying to incorporate predictive maintenance, as well as the benefits of doing so. As many of you may know, there are two types of maintenance, corrective and preventive. Corrective maintenance is typically performed in response to an aircraft failure.
Unfortunately, this can result in downtime of the aircraft, including flight delays or cancelations. In the worst case scenario, and AOG, Aircraft On Ground situation, may occur, which requires emergency transportation of the parts, and equipment, and additional maintenance staff to get the aircraft back in operation.
On the other hand, preventive maintenance is a type of maintenance that is performed on a regular schedule to prevent components from failing. Hard time and on condition are the type of maintenance that is performed based on aircraft flight time or cycles. So these are called time-based maintenance.
Condition monitoring involves monitoring sensor data of components to detect and address potential issues before failure, such as monitoring engine vibration trends. Predictive maintenance is a type of condition monitoring approach that involves using various sensor data and more complex analysis techniques.
Anomaly detection can identify unusual patterns in systems. While the failure prediction can predict when a component is likely to fail. This enables us to schedule maintenance activities at the optimal time, preventing unexpected downtime, reducing costs, and increasing overall efficiency.
During this decade, aircraft and component manufacturers, as well as MRO, I mean Maintenance, Repair, and Overhaul companies, have launched data analytic solutions to enable predictive maintenance.
As an airline operator, we have a unique advantage with access to both operational data and domain knowledge. The integration of avionics enables us to acquire various time series sensor data during the flight, which is called a Quick Access Record, QAR, or Continuous Parameter Logging, CPL.
Of course, we have detailed maintenance records when and how the failure was observed and the corrective actions to resolve them. We utilize MATLAB as one of the data analysis tools for visualization and hypothesis testing. MATLAB allows us to gain the insights from the sensor data, such as identifying the root cause component and the signs of failure.
These insights are also instrumental in developing machine learning models for predictive maintenance. And we can easily train machine learning models based on the insights with MATLAB and deploy them in our data pipeline to evaluate the real time sensor data. OK, next, we will proceed to the case study, anomaly detection of Boeing 787 air conditioning system. Noaya-san, please.
Thank you, Sadanari-san. From here, I will explain the process of detecting degradation. This time, we will focus on the cabin air compressor, which is a component of the air conditioning system. First, let me introduce the system.
As you may know, airplanes fly at high altitudes where the outside temperature and pressure are lower than ground level. To ensure comfort inside the cabin, the cabin temperature and pressure must be maintained near the ground level. The air conditioning system plays a critical role in maintaining cabin pressure and ensuring a comfortable environment for passengers.
And due to limited space on airplanes, the air conditioning system needs to be simple, compact, and lightweight. From these conditions, the most suitable structure is the method of the air cycle refrigeration. By the way, the air conditioning system is located under the cabin area.
Considering safety, the air conditioning system is equipped with two identical system, left side and right side. And the cabin air compressor is located on the air conditioning system and equipped with two on one side. And there are total four on both sides.
This slide introduces the cabin air compressor and how to relate it to the air conditioning system. The air conditioning system uses air cycle refrigeration to convert high temperature and compressed air to low temperature and low pressure air. For Boeing 747, the source air is compressed air from the cabin air compressor, which is shown in the table.
The cabin air compressor is a type of centrifugal compressor that compress outside air using centrifugal force. And it is powered by an electrical motor. The impeller and shaft used to compress outside air are supported by journal bearing and the thrust bearings, which are a type of air bearings.
Now, we will explain the analysis process. The process was three steps, decision of target failure, hypothesis planning, verification. First, we will explain the process that decide target failure. First, we focused on the degradation of the journal bearings.
The journal bearings consist of outer housing, top foil, and inner foil. The journal bearings maintain the shaft by passing the air between the outer housing and top foil. The inner foil maintain the airflow path. The degradation may be the starting point for any failure.
You can see in the pie chart that journal bearing failure account for about 50% of defective parts in the cabin air compressor. Second, we will explain the process of hypothesis planning. This is the most important section, which requires deep domain knowledge. We have deep domain knowledge about not only the structure of the cabin air compressor, but also behavior and operation during flight.
Our knowledge of cabin air compressor structure come primarily from disassembly in our repair shop. So we were able to confirm degradation of the journal bearing after disassembly and the using that difference for this analysis. We found that the journal bearings' degradation was caused by the formation of the inner foil and the top foil.
These deformed parts caused an uneven airflow path, leading to increased friction between the shaft and outer housing when they come into contact. We obtained information about the cabin air compressor's operation and behavior from documents and the flight data.
The documents provided us with basic behavior and operation. And the flight data confirmed the actual behavior and the impact of [INAUDIBLE] component in the cabin air compressor. Using all of this knowledge, we developed our hypothesis.
Third, we will explain the process to verify the hypothesis. We verified the hypothesis using recorded flight data collected once per second of over 300 flights, which is about one year for an aircraft. Most importantly, operation or behavior of the cabin air compressor are different on each flight because the surrounding environment, for example, outside temperature, speed, different on each flight is influenced.
To find the degradation, we used an iterative process that involved examining a graph of the data and revising the hypothesis. We repeated this process many times. But we were able to execute this process quickly due to MATLAB's fast processing.
As a result of this process, we found the degradation in the flight data. Then we calculated the average of the part of each flight. We compared cabin compressor one and cabin compressor two due to the same operation and plotted this time series data. This time, we calculated the difference between parameters of cabin air compressor one and cabin air compressor two.
The graph you can see on this slide is an example. Normally, when cabin air compressor one and the cabin air compressor two are healthy, the value of difference is around zero. However, we found the value of the difference become large as journal bearing degrades.
OK, thank you, Naoya-san. So comparing two systems running in parallel is a simple way to cancel out the effects of external environment. However, setting a simple threshold for anomaly detection is difficult. Because if both components degrade in the same way, they are not maybe-- not maybe any noticeable difference between them.
As a result, we developed a machine learning model to estimate the degradation without the comparison. We corrected over 10,000 flights as data points and external environment data as features. Along with corresponding maintenance records has two reveals. Using the MATLAB Statistics and Machine Learning Toolbox, we trained and validated our models on the graphical user interface.
So here are the results of the variation. The red dots on the graph represent a historical degradation index of a CAC based on a machine learning model. And the red line represents a moving average. The CAC was replaced in December 2022 due to bearing failure. It is worth noting that the degradation index tends to increase as the failure approaches.
In terms of model's performance, the overall precision is 77% and the recall is 23%. Given the nature of this scenario, where we prioritize avoiding false positives, we have placed a higher priority on precision. We have also developed a data pipeline for the machine learning models, enabling us to monitor the degradation index in near real time.
The collected sensor data points and other external or environmental data will be automatically input into machine learning model. Thanks to the MATLAB compiler, we have been able to summarize the entire analysis process into a single executable file. We monitor flight data on a daily basis. And as a result, we have successfully predicted several journal bearing failures about one month prior to their occurrence.
OK, so here is the conclusion of our presentation. First, predictive maintenance is expected as new strategy that reduces downtime of the aircraft and increases the efficiency. However, data analysis, such as feature engineering and hypothesis testing of a complex system, is difficult without domain knowledge.
As an operator, we are trying to utilize the domain knowledge and operational data to find the insights. This case study shows that machine learning can be also applied to anomaly detection of aircraft systems. And our future goals are to improve the precision and record, as well as the interpretability of machine learning models because engineers always like to know why the degradation index is high and also to accelerate the data driven maintenance to other systems and components, in order to improve our productivity.
So thank you very much. This is the end of our presentation. From this April, we have a new company management vision, Uniting the World in Wonder. As a maintenance staff, we are committed to ensuring that our customers have a wonderful flight experience. We look forward to having you enjoy a flight with us someday. Finally, I would like to thank all of the team members in MathWorks who supported us. Thank you very much for your attention.
[AUDIO LOGO]