Embedded controller development for power converter applications
Overview
We will use a SEPIC circuit topology to show how to model and simulate a DC-DC converter. Using Simulink® and Simscape Electrical™ MathWorks engineers will show how to develop, simulate, and implement a controller that maintains desired output voltage in the presence of input voltage variations and load changes to achieve fast and stable response.
Highlights
- Modeling and simulating passive circuit elements, power semiconductors, and varying power sources and loads
- Simulating the converter in continuous and discontinuous conduction modes
- Determining power losses and efficiency of the converter
- Tuning the controller to meet rise time, overshoot, and settling time
About the Presenter
Ramanuja Jagannathan works on modelling, simulation, control design and simulation deployment for mechatronics applications. He has experience working in customer projects involving design of mechatronic machine design, robotic manipulator, reinforcement learning based controller and digital twin deployment. Before joining MathWorks, he was as a Senior Engineer at Larsen and Toubro working in project planning and control of Railway projects. His academic background is in Process Control, and he did master’s programme at National Institute of Technology, Tiruchirappalli, India.
Recorded: 12 Apr 2023
Good afternoon to all, and thank you for joining our webinar on Embedded Controller Development for Power Converter Applications. Before we start our webinar, there are a few points to consider. You can join the audio by clicking the call using Computer option and ensure your speakers are not muted. In case of any issue, please feel free to contact the host using the Chat function.
This is a two-part webinar series where we cover these two topics. So please ensure you attend the second session as well, tomorrow, to get a full understanding of that topic.
Here's the agenda for today. Our speaker from MathWorks will be taking you through the session. The session is for a total of 60 minutes, where we have 40 to 45 minutes for the presentation and the rest-- 10 to 15 minutes-- we'll use it for answering any Q&A.
So here's our speaker for today. Mr. Ramanuja Jagannathan-- he's a Senior Application Engineer at MathWorks India. Ramanuja works on modeling simulation-- control design and simulation development for mechatronics applications. He has experience working in customer projects involving design of electronic machine design, robotic manipulator, reinforced learning-based controller, and digital twin deployment. Before joining MathWorks, he was a senior engineer at LNT working in project planning and control of railway projects.
You can post your questions to the presenter at any time during the webinar by using the Q&A panel on the right side of the Webex window. We will also have polls during the session, which will pop up on the right of your screen. I would now like to hand it over to Ramanuja. Thank you.
Thank you, Prashant. Am I audible?
Yes, Ramanuja.
Thank you. Let me share my screen. Is my screen coming through? Are you seeing my screen? Can you confirm it, please
Yes, I can see your screen.
OK, thank you.
Yeah, Hello all to the audience. Thanks for joining the webinar. So today I'll be talking about Embedded Controller Development for Power Converters. So as Prashant mentioned, I have some experience working with customers using MATLAB tools for the power converter development, and I'll be sharing some of my experiences on what are the best practices to-- on how to use the tool for power converter development.
So when we talk about power converter-- so typically, we think of some power electronic systems, which has variable input flows, variable output flows. The input and output could be AC/DC regulated and unregulated. So you have several combinations. And the primary job of the power converter is to basically provide a regulated power supply to the load and also do the energy transformation from either AC to DC, DC to DC, or different combinations.
So typically, you would find a controller here as well, which is typically a PWM controls. And the task of the power converter, instead, would be to develop the hardware and also to develop the control logic, which would help to find-- which will help to regulate the output energy based upon the requirement.
Some of the typical challenges we find-- the power electronics engineer is facing-- are basically how to size various passive components. So when we talk about power converters, something like an SMPS, we typically have a lot of passive components, like your inductors and capacitors. One challenge is sizing these components so that you operate at the right conduction mode-- either continuous or discontinuous mode. That could be one challenge. The other challenge could be performing power loss analysis and thermal behavior, basically trying to do a trade-off between your connection loss or switching losses so that you get maximum efficiency out of the power converter.
Once things are done on the hardware side, then typically, you would go on to the control side where you might want to develop a proper compensator algorithm so that you are able to do the regulation as per your requirements within some price time and within a certain overshoot. So that's the job of the controller developer in designing the-- in designing the PID gains or some compensator gains as well.
And finally, once the controller is done, then typically, you would want to deploy that controller to an embedded processor. And here, you are more focused on the particular embedded platform and how to port your logic into that particular platform.
So these are some of the challenges. And in today's webinar, I will be walking you through a demo of the SEPIC converter. So SEPIC converter is something-- it's about boost converter. You'll find it in various applications where you want to do DC to DC conversion.
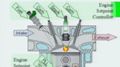
So one application is the LED headlamp, where you might want to regulate the brightness of the lamp. And you're trying to do that by giving set points of all this to the controller. You expect the converter to, basically, set the appropriate brightness for the LED lamp.
So I will walk you through the design and development of power converter for this particular application today. Yeah, so let's move on to the MATLAB window so that we directly get into the development process. So let me start sharing my MATLAB screen.
All right, so at this point, I would also like to understand, from the audience, what is your motivation of attending the webinar? And probably, you are more interested in the software side or the hardware side, firmware, or even the control logic side. So what would happen is that there will be a poll question which will pop up. And in that, you could give your answers appropriately so that it also helps me to understand what kind of audience I am facing so that I could relate the content accordingly.
There would be, also, a few more questions in it, basically asking about how you can get in touch with us. So the poll will be open throughout the webinar, and please feel free to answer that whenever possible before the end of the webinar.
So let me load the MATLAB window here. OK, so you see the poll just popped up. So please feel free to answer that. As I said, it's open throughout the session today.
All right, so what you see here is basically the MATLAB project interface. Now, here, I'm able to store all my material for today-- on power converter development, and I'll walk you through the different demos I have over here. So I have some project shortcuts, so let's go to that and let's see a few of the models.
So as I mentioned, the first challenge is on component sizing. So let's click on that and see how we can do a component processing activity.
So what you see here is basically the implementation of a simulation model of the SEPIC converter. So over here, you see that we have a power supply of 12 Volts. There is a switch over here. There are a few passive components, like inductor and capacitor. And we have the load systems over here.
Over here, we also measured the output voltage, and we also measured the input current so that we understand what mode the security is operating in-- whether it's continuous, discontinuous, or a different mode. So once I have the circuit done by the way, these blocks are available in the library. So if I go to the library browser-- if I go to the toolbox called Simscape and that-- if I go to the electrical domain-- so you would find all these blocks available over there. So you can use your block libraries to basically build these models.
For example, we have sub libraries for your semi-conductors, passive components, and electromechanical machines and all. So you can use the appropriate block from these libraries to basically build the model. But assuming-- once you have built the model, now the challenge is that you want to parameterize the blocks.
Now, typically, for a particular converter, you would have equations which would give you the values of the different capacitor. And you would want to validate whether these values are going to be right. For example, here, I worked out that inductance is going to be for 470 microhenry. So basically I want to see if this is going to give me a continuous conduction mode.
So let's simulate it and understand what's happening. So I'll hit the Run button. And when the model is simulating, you would, here, see that on the scope, you could see the output voltage. So currently, the duty cycle is set at 0.6, so it's an open loop control system at this point. And for a 0.6 duty cycle, you could see the output is somewhere around 18 volts. So basically, a boost operation is what is happening over here.
So as you'll see the output voltage-- now I could also go and check the current value at the inductor input. So let's do that. And looking at the current value, I can understand what mode of operation is happening. So here, I could see that the current is mostly above 9, so it's not touching zero. So I could say it's a continuous conduction mode. But just to be sure, I can also zoom and show you the value.
So if I zoom over here-- so we can see the current is sustained between 1.2 and 1.4. And I can zoom it horizontally and then show that we have the various charge-- the charge cycles. And we can see that it's a continuous conduction mode.
Now, once I have made sure that it's operating in continuous conduction mode, now, probably, I can try various other values as well. For example, let's say I have a knob over here, which directly can-- which directly controls the inductant value. So I can click on the knob. I can change the value, let's say, to 10 passive and do the simulation again and see what happens.
Now, this is going to let me allow-- to try different combinations of passive values and then see which one is going to best help me in my requirements. So in this particular case, I see the value-- all these values about 20 volts. And if I go to the current scope-- yeah, so I could clearly see current going less than 0. So if I can zoom it a bit.
And so we could see that the current going less than zero. And we can also do a horizontal zoom and then see that-- what's happening. So definitely, the current goes within 0, so some sort of different modes of operation is also happening over here. And this lets me understand what mode of operation is going to operate for different values.
Am I back online? Thanks so much.
Yes, Ramanuja.
Yeah, sorry for the interruption. I think some network issue. So what I was telling here is that-- basically, I was trying to come to a concept of performing multiple simulations. So typically, you might want to perform a batch of simulations value or trying to alter single value or multiple-- or single parameter for multiple values, and then trying to see how the simulation performs.
So what I have over here is that-- the same SEPIC converter. But then I'm interested in studying how my different duty cycle values is going to affect my simulation output. So what I'm going to do here is-- I have just opened this option for multiple simulations. And if you see, it's basically opening up a design study. And over here, what I could do is I could tell what parameter I want to create a batch.
So for example, let's say I select a block over here. And so this block over here is basically denoting my duty cycle, so let me click on that. And let's click the duty cycle value. Now, what I can do is that I can set some values. For example, let's say I want to study 0.5 and 0.6. Of course, you can set more than two values. But here, for demonstration purposes, I'm just adding two.
Now, what I would notice is that the top button-- now it has changed to Run All. So there are two simulations to run, and it is going to run all. Sorry, is my screen visible to you?
Your screen is visible, Ramanuja.
OK, I think I got a message here on the-- OK, great. So now what I will do is that-- let me click the Run All button. And what's going to happen is the multiple simulations are going to run in the background. So you have an option to do the multiple simulations. There's something called a Simulation Manager. I can click on that. And it's going to show me the progress of different simulations.
So if I have, let's say, a batch of 100 simulations, it's going to show me the output of that. So then I can see the two simulations-- what I submitted-- the first simulation is running, and it's currently at 40%.
And the first one is there. Now the second one of running. So this would be for the duty cycle of 0.6.
Now, here, you can see that these simulations are running in series. But if you have the Parallel Computing Toolbox, you could run these models in parallel, in different cores of a machine. That would definitely help you to speed up the simulation batch. So let's wait for the job to get completed.
Yeah, so you can see, now, both simulations are completed-- 100 percentage. So what I would do next is I will go to Data Inspector. So before that, you can see that there is this Wi-Fi symbol at the output value, or this measurement. Now, this basically means that I'm logging the voltage values. Same as for the current value as well-- I'm logging the current values. So whenever simulation run, there's a data logging happening, and that's getting stored in my memory. So what I'm going to do is that I'm going to go to the Data Inspector and then see how my simulation performed.
So over here, now, you could see that I have multiple windows. So let's set it for just two windows because I wanted to signal of interest. So the latest simulation-- over here, you could see. And I could see all the signals from that. So I think this is the voltage-- I think this is the current signal, and here, I have all the voltage signal.
So let's say-- if I want to compare and contrast with the 0.5 duty cycle. Before that, I need to go one simulation before, which is the Run Number 4. I can go to signals. And the same two values-- but then let's plot it as overlaid. So here, I overlaid the signal, and same, here, I am overlaying another sigma. And this will get better clarity. I can also change the color of the signal lines so that we know what is what.
So basically, the blue color line corresponds to 0.6 duty cycle. The orange line corresponds to a 0.5 duty cycle. And here, I'm able to compare both the signal simulation results and understand what's happening. I also have a cursor option so that I can move around and then get exact values at a particular point of time.
So this basically lets me alter different parameters in a range of values and then see how my simulation is performed. Of course, this-- you could apply it for any values. Let's say the input voltage or the output resistor-- we can try to change different values using this particular process.
So let me close this and move to the next model. In the next model, I will be talking about how to migrate from this switch to a MOSFET. So typically, we would be putting some sort of transistor, and let's see how to implement a transistor model in the DC Converter. So let's close this model for now. And if I go to my shortcut , I can go to the SEPIC MOSFET.
So the same circuit as you saw before-- but a key difference here is that, instead of an ideal switch, here, we have a MOSFET block. So in order to parameterize this MOSFET, I need to have a data sheet of the MOSFET as well. So let me open the data sheet in Parallel. So again, I'll go to the shortcuts and open the MOSFET data sheet.
So here is the data sheet, and then let's get the model in parallel. Here, we have the model. So let me click on this MOSFET block.
So basically, here, we see that we have different parameters, which, basically, is what you find with the data sheet as well. For example, you have parameters to enter the static characteristics, like your R_DS, so we have these values over here. We also have parameters for your junction capacitance. So somewhere, you'll would find the junction capacitance value over here.
Now, this would be our typical dynamic characteristics of your MOSFET-- the transient behaviors. There are also provisions to enter thermal data. For example, here, we have thermal information-- the thermal resistance between junction-to-case and junction-to-ambient, which you could probably enter here as well.
So once you enter all these data-- so basically, you are trying to bring the MOSFET performance into this particular block-- simulation block. So let me go to the simulation model now.
So one more point you also find here is that this MOSFET block now has an orange color line. Now, basically, an orange color line typically denotes a thermal dissipation port. So if the MOSFET is dissipating heat energy, now, that would be a-- that would be emitted in this particular line.
So if I scroll down slightly-- so you would also see that this thermal line is connected to a thermal mass, which could be your heatsink, essentially. And it's also connected to the ambient temperature, which is 24-degree room temperature, through a convection mechanism. You're also able to model the heat dissipation effects using these particular thermal libraries. And you can do ah, heatsink sizing and then thermal performance analysis as well.
Once I have the model, next, let me basically go and try to simulate it.
So in this case, I have two scopes on the model. So one scope is basically showing me the output, the converter output. And the second scope is trying to show me the heat flow from the transistor.
So since I have an actual internal MOSFET, and this block is trying to simulate the actual physics of the MOSFET, the simulation is trying to-- the simulation is going to be slower compared to the previous simulation, where we simply had an ideal switch. And the reason is because we are trying to capture more details, like the dynamic architecture of the MOSFET and the thermal effects as well. So you should expect some amount of load as compared to the previous model.
So while the simulation runs, I can also open the scope and then see what's happening, meanwhile. So if I go to the voltage scope, I can see that the voltage is already converged to a certain value. I think it's coming to around 10 volts, which is good. And I can also go and see the current plot. So let me just stop the simulation at this point so that I can talk about the heat flow graph.
So if I click on the scope for heat flow-- so you could see that the heat flow is consistently rising because-- since we started operating the MOSFET, it's getting constantly heated, and we can see the heat flow increases as temperature rises. So with this particular block, you are able to simulate the thermal effects as well. You're able to study what the temperature at the junction and what is the heat dissipated, how to design thermal sinks-- heatsinks, and then have a better cooling mechanism.
So those are some things what we can simulate with this particular MOSFET block. But sometimes I do have customers asking me if we can import, let's say, a SPICE model into the simulation, or if we can do some switching-- switching dynamics and capture switching losses. So sometimes you also want to capture the conduction losses and switching losses. So what do we do in that case?
So let's go on to another model, and then I can show you how we can put a SPICE model into a Simscape. So if you have some ICs with you, you can try to put that into the model as well. So let's go to this model, and let's go to the shortcuts now.
Yeah, so at this point, what I'm trying to do is that I'm going to import a SPICE model into MATLAB. So I have some scripts over here. So the first script-- if you see-- is basically a documentation to this command called a subcircuit2ssc. What this command allows you to do is that it allows you to import a SPICE Netlist into Simscape so that you are able to simulate a SPICE Netlist in your Simscape model as well.
Through this, basically, you need the subcircuit2ssc model of the file or the SPICE model-- what you want to simulate. And once you have the subcircuit model, basically, what Simscape will do is that it will try to build an equivalent Simscape model from that and parameterize all the values as per the SPICE Netlist model.
A word of caution is that certain commands may not be supported, and we have documented the limitations as well. So you can go through these limitations to see if your SPICE model will be supported. But let's say that we have a SPICE model which is supported. And I will show you the Netlist for that SPICE model.
So I have the second part of-- a BUCK converter subcircuit. So basically, here I'm defining the BUCK Converter topology with some switches and diodes and integral capacitors. And you can also see the diode characteristics and the switch characteristics as well.
So the entire schematic is a particular substitute. So what I'm trying to do is I'm trying to-- I'm going to import the substitute into my Simscape model. So to do that, I need to execute the substitute command. So let me do that by clicking the section.
Now, what would happen is that this command itself creates this subcircuit library. So I have a folder here called My Converter Lib, so I can actually delete that and run the command again. So if I run the command once again-- so you'll find the converted library getting populated again.
And basically, this consists of Simscape which has all the equivalent Simscape model derived from net list. And here, you could find your switch and diodes and everything.
So once you have this file, now what you can do is you can create a library out of it. So here, there is a command called-- it's a C build. And when I run the command, the Simscape file is converted into a library.
So basically, if I click this library now, I have a block, which basically denotes my-- the button, whatever I have. So it has the vcc port, the gate terminal, the output terminal, and the ground terminal. So with this block, I can go and simulate a model in Simscape. And basically, I have this model over here. And here, I have the power supplier here. Yeah, I think that's interchanged.
The power supply is connected to vcc. And then, the gate is connected to the pulse generator. And we have the output connected to the resistor, which is a 5 ohm load, and the ground is connected here. So now what I can do, I can simply click Run. And this model is going to execute. And I can see the simulation output of my SPICE output in Simscape.
So this is basically my simulation output. And you could see that the buck converter is basically regulating the output at around 7 volts. But this is one option how we can import a SPICE Netlist into Simscape. So basically, the requirement is that you need to have the subcircuit model. And once you have that, you can use the subcircuit command and then import it into the Simscape library also.
So let's close this. So another question I get asked from customers is that, how do I basically study the switching thermal losses? So when the gate switch is on and off, the MOSFETs, so how do I study the switching losses and connection losses? So to do that, we have a different block available in the library. So let me go to that particular block.
With that, let me open a model which has the block implemented. So here, I'm using a different MOSFET block. So this MOSFET block is an ideal switch. And if you open this, so basically, you can see it's asking me parameters, like the on resistance, the switching losses, and the thermal port details and the diode details as well.
So you could observe that. Here, I'll be able to select a particular part number. So basically, here, it's an STM product. I can click on that. And what would happen is that I will be able to see a catalog of semiconductor products from which I can choose an appropriate product for my particular applications.
So here, you have the MOSFET parameterization, different vendors. For example, Infineon, RO, STMicro, Wolfspeed. So what I need to do is that I need to click on a particular model. And you could see in the bottom, the block parameters are getting updated. So most of these parameters are derived from the datasheet of that particular component. And the datasheet link is provided over here.
So a point to be noted here is that these parameters are derived based upon some engineering adjustment. So it would be best to basically validate these models before using it in production. But these models could be a good starting point for your applications. And you could see that most of the values are updated from the device data sheets. And certain values might have some adjustment, engineering adjustment, and which you could validate in physical setup.
But in this case, I have already chosen a particular device. So I have chosen the SDMicro device. And if you notice on these switching losses parameter, you could see that it's basically asking me, what is the switch on loss and switch on loss? So basically, I'm trying to give my switching loss as a function of current. So based upon the different current values, I have created a lookup table over here. And these currents are basically your on current.
And we also have the off-state voltage of the transistor. So when you see in a particular transistor, you-- when the transition adjusts from, let's say, off to on, basically, you're turning on the transistor. And the current would increase. And the voltage would decrease. So basically, the power loss is a product of these two terms. So basically, the power loss will depend upon the voltage and the current.
So here, we are trying to formulate a lookup table between the voltage and current. And once you have the lookup table here, you will be able to do the switching thermal loss simulations as well. So here, it's clearly given the temperature is 24 degrees. And then, the VD is basically at 400 volts. But of course, this could be extrapolated to different operating regions as well.
So to understand what values I can get from this simulation, I have basically a pro block over here. So let me keep on the pro block. Now what this will do is that once I click on any Simscape block, let's say simply click on the MOSFET, now I'll be able to see all the variables associated with that particular MOSFET.
For example, let's say in a MOSFET, you have your ids. You have your voltage, vds, vgs. And then, you also have your switching losses. So for example, your connection losses and then the switching losses. So all these variables can be observed in a graph, in a plot. So you need to select the variables of interest. So here, I have selected a few. And once I have selected all the variables of interest, now I could go and simulate my model. And let's run the simulation.
And so, yeah, it's basically for 100 microseconds. And if I go to the model over here, so if I go to the simulation graph, you could see the switching losses over here. So you could see the OffLoss and OnLoss. But this is when the off event transistor. And this is when the on event transistor. And here, you have a connection loss, basically.
So I could see all these different values coming up. And this helps me to understand how my losses are getting divided between the switching and connection losses. For example, let's say if I have more feature loss, than probably I could decrease my duties-- decrease my frequency of operation. So here, this MOSFET is driven by the PWM block. So if I go to the PWM block, I can basically reduce my frequency of operation or increase it so I can make those optimizations.
And one more point here is that here, this MOSFET is connected to a heat sink directly. So that is a thermal disaster over here. So the MOSFET is connected to the thermal resistor. And that thermal resistor is, again, connected to a heat sink. So basically, you can define your-- the heat sinks are dimensions like your height, thickness, depth. You can also define the fluid properties of air and also define some dynamic properties of the heat sink also.
So once you have this particular simulation results with you, now you can go ahead and then check how the power loss is affecting your overall efficiency. Through that, let me go on to a script. So let's move to the script, which would help me calculate all these details. So here in Simscape, we have define function, which would help you to extract the power losses and give you a summary.
For example, there is a function called getPowerLossTimeSeries. Now what this would do is that it links into the simulation log data. For example, here we have a variable called out. So that out will be typically storing my simulation log data. And it looks into the log data. And then, it basically gives me a summary of what's happening in my simulation with respect to power losses.
So if I run this particular section, now what would happen is that, basically, it's trying to segregate a connection loss and the switching loss. So here, I have the connection losses in MOSFET, in Resistor and Gate_Driver. So these three components are giving me connection loss. But since MOSFET is the one database which is switching, so we can see switching loss in the MOSFET only.
And in order to see the conduction loss MOSFET, I have basically just entering this command over here so that I can see all the values of conduction loss. So you can see, the left-hand side column is basically the time. And the right-hand side is basically-- the rightmost is basically the watch, which is loss of energy. So this is basically a time series of your conduction losses in the MOSFET.
And correspondingly, now you see the switching losses in MOSFET as a tabulated data. The same data what we saw in the prod as well. But then, here I have brought it into MATLAB. And I could-- I'll just write it in different sense. Now since this is a time series, it may not be easy to understand. I can also have a summary of the data. So basically, if I run this command, power loss summary, now what would happen is that it shows me which device is losing how much power.
For example, if I go to the MOSFET, I can see it's losing about 43 watts in connection loss and then about 100 watts in switching losses. But if I go to the resistor, it's losing about, let's say, 24 kilowatts. All right? Now that means that the resistor is taking most of the power for the output itself. And that is good.
And in order to calculate the efficiency, I have another function, basically, get efficiency. And if I run this, so basically, I'm telling that my resistor is my load. And I want to see how much energy is getting transferred to the load. And here, I can see 99.4 is getting transferred to the load. And I think the circuit is operating in a good mode.
Of course, what I showed is hypothetical circuit. It's a simple characterizing circuit. And it's giving good efficiency. But then, you can use these functionalities to basically try to implement real power converter models and then see how the power loss is getting distributed between connection loss and switching loss and between-- across different components.
So one interesting utility here I would like to point out is this GRABIT. So let me open that, documentation for that. So most of the time when I talk to customers, they want to plot or they want to extract the data from a datasheet. So typically in datasheet, you have the values of your power losses in graph. And you want to extract that.
So for that, we have a utility called GRABIT. This is not a MathWorks product. But then, we-- I find it really useful. So that I use this to basically extract data points from a graph. And to just show you how it works, so I will install GRABIT in my system. I'll just run this, run the command. And basically, it's going to bring this window.
And here, I need to input a draft. So this is one of the draft from the datasheet. So the estimate of what I use to-- this draft is basically taken from the datasheet. And let's say I want to get the cloud data for E total. So what I need to do is that I need to first tell the utility, what is my x-axis and y-axis? So I can go quickly and then point out my origin.
I can tell this is 20. It basically asked me the high set of the x-axis. And I can point here and tell it's around 80. Now it asks me about y-axis details. So I can point here and then show to zero. And at the high side, it is asking me. And I can basically enter 800. So once I understand what is x-axis and what is y-axis, then I could basically go and grab points.
Essentially, I will hover over the scope, collect some points of interest. So I'm selecting the points on the curve itself. So let's close it here. And once I have done selecting all the necessary points, I can click-- I can press Enter. And then, I have the data on my workspace. So here, I could see that. And they could rename it as, let's say, E total.
And this data is basically a two column data. So the first column is basically your current access ID. And the second column is basically your energy in microjoules. So I can come to MATLAB and then type Etotal. And then, I could see the data in my MATLAB.
So this utility helps me to extract the data from datasheet so that it's easier to parameterize my MOSFET models. Or typically, when there are some lookup tables, which I need to enter in my block. So that's an interesting utility. I think this would be useful to most of you who are working more with datasheets and trying to parameterize your discrete components.
Right. So another interesting functionality is also to find out harmonics. So typically, when you-- this happens when you work with AC source. Sometimes, you want to have a unity power factor. And then, you want to see how much harmonics is present in the system. So there are ways to find out harmonics as well. For example, here I'm taking an example of a simple three-phase rectifier. So there is this voltage source. And then, we have a rectifier unit. And then, there is AC block.
So if I run the model, now one thing we had noticed is that there is a spectral-- spectrum analyzer over here. And this spectrum analyzer would update the frequency response on the go, so when the simulation runs. So you would see some spectrum analysis over here. For example, here I'm seeing the first peak is happening at 60 hertz. And the second peak is happening at 300 hertz. So I could see the different spectral content. And this keeps on updating as per the assignment. The simulation is progressing.
But then, we can also take the entire simulation data in a log format and then do some offline analysis as well. So for-- to do that, let me come to MATLAB. So first, let's verify if the data is logged. And I have it here in my workspace over here. So that's that. So that is an app called as a harmonic analyzer app. So let's open that.
Now this app is going to input my simulation output. And then basically, it's going to give the spectral content in different signals. So here, first, you need to tell what data to analyze. So I just log the data from simulation so I can import that.
Yeah, here it is. And click OK. So the signal of interest for me is that I want to understand, what is the current at source? So how much is rectifier affecting my-- the input current? How much harmonics is injected into that?
So let me click the current value. Now what's happening here is that I'm able to see the entire current signal through the simulation. So I could do a few more things here. But first, let me rearrange it.
Let's try. Yeah, so this is my complete signal of the current data. The first thing I could do is that I could increase my number of periods I'm interested in. For example, let's say I want to have more periods in which I want to do my analysis. The window, I could increase, basically. So let's increase that.
And once I increase that, now I could go on to the harmonic plot. And here, I'm able to see the harmonic. So that's the first harmonic, second harmonic, third harmonic. So I could see that as well over here. So basically, I can see the percentage of the fundamental frequencies, 100% of the first harmonic. And the fifth harmonic, it's at 10 percentage. And you can also get the THD over here. It's 13.99. So you can also observe the periods quantitatively in this particular plot as well.
Also, if you feel that there are more and more harmonics, you can basically increase the harmonic order. And then, you could see that additional harmonic signals included into the simulation. So this is one way for you to understand the harmonic content and design your circuits so that you are not injecting much harmonics into the input supply.
All right. Let's go back to my project window. And a few more things you can do with Simscape is that you can do tolerance study. So essentially, so let's say that you have a model. And then, you want to basically study the effect of parameter variations on, let's say, the gain of a model. For that, let's take a single use case.
So I'm having here a LLC DC-DC converter model. So the components in this model, basically, audio capacitors and inductors. And in real life, you would have some amount of tolerance in these values. For example, if you open the inductor, it's not going to be a fixed value. There is going to be some parameter variations in that.
So basically, here I can capture those parameter variations. So I can put some tolerance values over here. I can see random tolerance and some uniform distribution. I can mention all that. And I can basically define how my inductance is going to change during the simulation.
The same happens with capacitance as well. Now because of this tolerance effect, when you change the value of a single component, the overall system value also gets changed. And in this case, the system parameter, what we're interested in, is a gain of the DC-DC converter.
So the question is that, the component change, how is it affecting the overall system parameter change? So that's a question. And to address that, we can write a MATLAB script which basically does a Monte Carlo simulation on different combinations of your inductance and quality factor. And you can understand how your tolerance is playing on the overall gain of the system.
To do that, let me open the script. And let's walk you through that. So let's undock this. So what I have here is an app, which basically, I can put all the parameter values, like what number of transformer, number of transformer ratio, and the load and capacitor value, all that. So what's happening here is that-- let me scroll down to the end and show you.
So basically, here I'm trying to change the quality factor and then the inductance ratio between the magnetic inductance and the original inductance. And for different combinations of these values, what are the change of my voltage gain, the tolerance and voltage? And so that's what I'm trying to study. So for example, let's say if my inductance ratio is at 0.5 and the quality vector is 0.2, then probably my tolerance in voltage gain is going to be 40%. And that's the inference I have drawn.
And I could do that by doing-- and I could get this inside by performing multiple simulations in parallel. And in this case, I think we are performing around 4,000 simulations in parallel in different combinations. And this helps me to understand how my overall system gains is getting affected with this particular component values.
So I'm not going to run this model because it's 4,000 simulations. But then, you do have a capability from Parallel Computing Toolbox to make it faster and then finish all those 4,000 simulations. But basically, at the end of the day, you get a plot like this, where you are running a Monte Carlo simulation and understanding the effect of a component parameter on a system parameter.
Now, until now, I have been talking mostly about a single power converter. But typically, a power converter would feed into some larger system. And you might want to simulation a larger system. And let's see, how do we tackle that?
Just a time check.
Yeah, I'll try to wind up in 10 minutes. Thank you. So what model you're seeing here is basically an onboard charger. And here, you have the brute force. Here you have a battery at the other end. And basically, the onboard charger is performing an AC to DC conversion and then a DC to DC conversion and converting the power from the grid to the battery DC voltage.
So one thing you notice here is that we have multiple stages over here. One is totem pole converter. And another one is DC-DC converter. So here, I can type-- I can deep dive into a totem pole converter and talk more about that. But I'm going to focus on the DC-DC converter right over here. And the reason is because when I click this Open, when I go into the subsystem, so here you'll find three subsystem in parallel. So one is highlighted. And two are shaded. So what does it mean?
So basically, I'm having three implementation of the same DC-DC converter. For example, if I go into the average converter, it's basically a simple average model. Nothing much. So it's basically converting one source to another source. There is no switching involved over here. But let's say if I go to the average switch converter, now here, one is the switch is an average model. But then, we have the transformer and the diodes implemented as nonlinear components as well. So this is coming closer to the reality.
But then, if I go to the rightmost model, here I would see that even the switches are basically implemented using MOSFETs. If I go into this, I could see the MOSFET block present over here. So what's happening here is that from left to right, we are increasing the detail of simulation. So the leftmost block is the lowest detail and It's an average model. The rightmost block is the highest detail, which is having all switches into it.
And typically, when you want to simulate such models, you might want to start from a low fidelity and then go on to a high fidelity. And Simscape offers that ability as well through variants. So basically, what I can do is here I can right-click this box. I have an option to select which implementation I want to simulate.
So let's say if I want to go with AvgConverter, I go to the AvgConverter. And you would see the AvgConverter highlighted now. And whatever implementation I select, now that is active. And when I simulate, only that is getting simulated. And the other two are not getting simulated.
So this allows me to basically have a model where I have a detailed model along with the average model so that I could have a quick simulation and also a detailed simulation as well. So both are possible. And that's a good model. Again, this model is available as an example. So I won't go into the simulation for want of time. But then, you can check these examples yourself.
So the final topic I want to touch upon is controller tuning. So until now, I have covered on the hardware side how to design the hardware, how to design the thermal, efficiency thermal heat sinks and all. But now let's go onto the control side. So when I come to the control side, basically, let me go back to a specific converter. And if you remember the previous model, we had an open loop control.
But in this case, I'm trying to have a closed loop control. Very particularly, I'm having a voltage mode control. So you could see I'm taking the feedback from the voltage output. And I have my reference voltage also available over here, which is 20 volts. And if I go into the control block, I can see that it has ADC software and PWM. The reason we have these three subsystem is that, later, I am also planning to deploy it to the infrared target. So I'm basically developing models for all these components.
So if I go into this core software logic, so here is where I will find the control logic. And so basically, here I have PI controls. And it has a saturation effect over here. And you can see the feedback signal coming over here. The error signal present over here. Now when I have PI controls, so this PI controller will have some PID gains as well. So let's look into that.
So here, I have PI high gains. So this gain is going to help me stabilize my output voltage. So let's try to simulate the model once before I do any tuning to it. So let's run the simulation at this point.
So let me open the scope. And let's see how the results are coming up. So as I mentioned before, the reference voltage is kept at 20 volts. So you could see that the value is coming to 20 volts quickly in 0.1 seconds. So it means the controller is already good.
So let's see that if we can try to improve this. And what are the techniques to improve this, the controller gain? So let's look into that. Well, I'll go to the PID block. And now, yeah, so there is an option to tune the PID gains. So let's click on this block.
Now what this option is going to let me do is that, first, it will try to generate my model. So it tries to linearize the model. It tries to get a transfer function out of it. And once it has a transfer function, I can go and apply my frequency to my techniques and try to find out good PID gain.
But in this particular model, you might not be able to find a transfer function because we have some switches. And switches has discontinuities. And that doesn't allow for transfer function. So when the app opens, it's basically going to tell that I'm not able to generate the particular model. So yeah, so you can see that-- you can see a flat line, which means that you don't have a good linear model of the plant.
So now, what I need to do is I need to estimate the plant model. For that, I can use some lab data if I have something. But then in this case, I don't have any lab data. But I have a simulation model. So I can simulate different excitation inputs and then try to see how my system responds to it. So let me do that. And in this case, I'm getting it from simulation data. So let me click that as well.
Right. So what's going to happen is that I'm basically going to give an perturbation as a step signal. And I'm going to observe the response. Where we're with the perturbation, so since I'm doing it around the PID block, the perturbation will be given here at this input. And the result would be observed in this particular signal.
So we have a feedback signal over here. And I can see the result over here. So basically, the PID block will take this as an input and the signal as output. And it will try to do a system identification of the perturbed signal results.
So let me design the input signal of interest. So let me click on this icon. And let's design a step signal. So this is going to be the signal I'm going to inject.
So I have some data. So let me try to give an excitation of 0.1 duty cycle. And the initial excitation, let's keep that 0.5. And I think the other data, I saw 0.4, 0.8?
So with this, I can basically click Run Simulation. Now what would happen is that the input, what we just designed, a duty step from 0.5 to 0.6, now that would be injected due to this model. And we would see the simulation results.
So let's go into the model and then see what's happening there. This could take a couple of minutes. So let's go to the model and see the results as and when it happens.
Yeah, so you can see the step signal being given. And I am able to see the output of my plant model. That is basically the output voltage of the power converter.
So while this is running, let me try to-- so this could take a couple of minutes. Let me try to answer some questions on the poll. And we'll come back to the simulation results. Let me tried to find the windows. So I think there are a bunch of questions. So let me try to answer a few of them.
So can we simulate for range of values at once? I think this was for the multiple simulations I was talking about. So yes, you can simulate multiple ranges. It's possible.
So in my case, I just gave two values. But then, you can simulate a range of values. 10, 20 values, you could do it. And it basically simulates all those results for you I think more is there in the documentation. Please refer to the documentation. And I think you would find more details to that.
So I have a question of, where-- one of you is asking, for a buck and boost converter with a MOSFET simulation that's not happening, but there was an IGBT, you're able to get proper results? I think we might need to look into the model itself for this, to answer this.
So if you have anyone-- if you know anyone from MathWorks, please reach out to us. And then, we can help you understand what's happening. But I think you should be able to do it with MOSFET as well. You can use MOSFET and get the simulation happening. So that should be possible.
Datasheet modeling for MOSFETs. So the option, what I showed in the MOSFET, going to the catalog of MOSFET values from diverse manufacturers, I think that's the latest feature. I need to check which version it came. It could be 2021 or 2022. I think I need to check on that before commenting. But it's pretty recent. So we need to check the recommendation on that.
There are questions on GRABIT. So GRABIT, one clarification, it's not for MathWorks. So technically, MathWorks will not be able to support you on that. But then, I think most of the customers who might meet with their user, even internally, I think-- even I use it, GRABIT. And it's a very useful utility. So try to search for GRABIT in Google. And then, you go to the File Exchange dimension. And you can download and start using that.
Is the loss analysis more accurate in MATLAB than with LT SPICE? So that basically depends upon, how did you parameterize your block? So again, this would-- this could change from case to case.
The benefit of MATLAB is that you can also dynamically change the temperature. The temperature is not fixed. You are changing temperature dynamically. So that's one benefit of MATLAB. And for example, if you have a particular model, you can try reaching to any MathWorks personnel, and then can help you into identifying whatever issue with that particular model.
There's a question on including SPICE model MATLAB and if it slows your simulation speed. I think, again, this is a very subjective question. Please share your model to any MathWorks contact we have. And we'll be able to try to help you on that. But I think it also depends upon the level of detail you are putting into the SPICE model.
Typically, SPICE model tends to be more detailed. And that could slow down the simulation. And then, that's where you also need to think about the fidelity. I think in one of the models I showed you, there is an average converter. There is a detail converter. You also need to think about what fidelity is useful for a particular use case. And that should guide us into choosing the appropriate block models.
So yeah, I think the simulation is done. So let me go back to my model. And yeah, let's see the output system identification. Yeah, here it is. So here is the output response for the input excitation.
So I could see that it's some underdamped oscillation. So let's accept that for now. And let's click Apply. And now with this data, input and output data, I also need to fit trasnfer function to that.
So I have different options, one pole two pole, underdamped. All these options are available. So I click any one option. And so let's say if I click underdamped, I can basically tweak it manually. But it takes more time. So I just do an autoestimate. So this will automatically estimate the underdamped response parameters for me.
Ramanuja, do you--
Yep.
Do you think we can close the webinar now? Or do you want to continue?
Yeah just a second, yeah. So I apply it. And then basically, so with this estimated transfer function model, I'm able to tweak my response. For example, here, I have the plan model now. I can basically tweak the response. So let's say I want more bandwidth. I can go for more bandwidth. And if I want more space, this version, I can go with more robustness.
And so now, we can see the system is unstable. So I can go back and decrease the bandwidth. So basically, I can tweak these dials. And I can see the PID gains as well. So if I go to the Show Parameter block, I can see the PID gains.
And I can use this to basically parameterize estimate block. Of course, whatever PID gains you get here, they are for the linear plan model. You need to validate that in a nonlinear plan model. So apply that once. And then, try to see if you're able to get a good response.
Just one more point. So another aspect is that we also can do a sinestream injection. So another popular parameter estimation technique is to inject a sinestream and then see how that works. So we do have an app for that. I'm not going deep into it today.
But I'll just show you the option. It's available. And then, we can-- I think you can go to the documentation and check it out.
So basically, this will help you to design a sinestream injection. From, let's say, 10 to 1,000 Hertz, you can design a sinestream, and inject it into the duty cycle, and then see, what is the response of your system? So you have options to basically design the sine signal over here. So this, I have done it already. So let me quickly show you the estimation for that as well. And we'll conclude that with that product.
So if I go to my folder here. And let me load this here. Yeah, so here I have the frequency response data.
So here, I could just pull it over here. And you can see the frequency response data. And this was obtained by injecting a sinestream from 10 Hertz to 1,000 Hertz. And if you want to see the bode plot of that, I can simply go bode and then put estsys1. And this would basically show me the frequency respond results in my model.
And additional benefit is that this same model, you can also bring it into the PID tuner. So here, we have an option to import the model. If I do an import, it looks into the workspace. And it picks the est system, estimator one.
So I can import this here. And so this is going to be a different plant model. Now what I can do is I can plot my frequency response and see the bode plot of that, the window.
So here, I have-- the dotted one is basically my default values. And the solid lines are basically my tuned response. I can further tune response. So I can go slower or faster. I can do that. So accordingly, we'll see the line going up and down as when I add gain. And also, I can change the phase margin as well. And this also gives me PID values. And this, you can use to tune your system as well.
So these are a couple of techniques. What I have, one, is your transfer function main method and one is your frequency injection method. So with this, I'll basically conclude on the control side as well. So one final remark. So basically, let me go back to my slide.
Yeah, so if you want to get more relevant training on these topics, what I just covered, so we have more focused trainings, hands-on training for you. So you could click on some of these links and then try to learn more about these tools, how to use the tools for a better generation control design and hardware design.
You also have a power electronics community in MATLAB Central. So you can join that and join the worldwide community who are using MATLAB for power electronic design. This also helps you to understand how others are using MATLAB. And finally, I have a link to the white paper. So basically, this white paper talks about how to develop power converters better using MATLAB.
And this white paper basically talks about different points, 10 different ways to improve your power converter design. So please go through these white paper points. And then, you can understand the topics even better. For example, I spoke about frequency domain tuning. So you can understand how that works better on this white paper. So have a look at this as well.
So with this, let me go to the next stage. The next stage is typically deploying the controller algorithm to an embedded hardware. And that's something we'll be covering tomorrow. And Gaurav, in the call, he will be delivering that session. So I would ask you to join tomorrow's session as well to understand how this algorithm would go into an embedded embedded world. And that would help you to understand the deployment portion of the controller as well. So with this, I'll stop my presentation.
Featured Product
Simulink


Select a Web Site
Choose a web site to get translated content where available and see local events and offers. Based on your location, we recommend that you select: United States.
You can also select a web site from the following list
Americas
- América Latina (Español)
- Canada (English)
- United States (English)
Europe
- Belgium (English)
- Denmark (English)
- Deutschland (Deutsch)
- España (Español)
- Finland (English)
- France (Français)
- Ireland (English)
- Italia (Italiano)
- Luxembourg (English)
- Netherlands (English)
- Norway (English)
- Österreich (Deutsch)
- Portugal (English)
- Sweden (English)
- Switzerland
- United Kingdom (English)