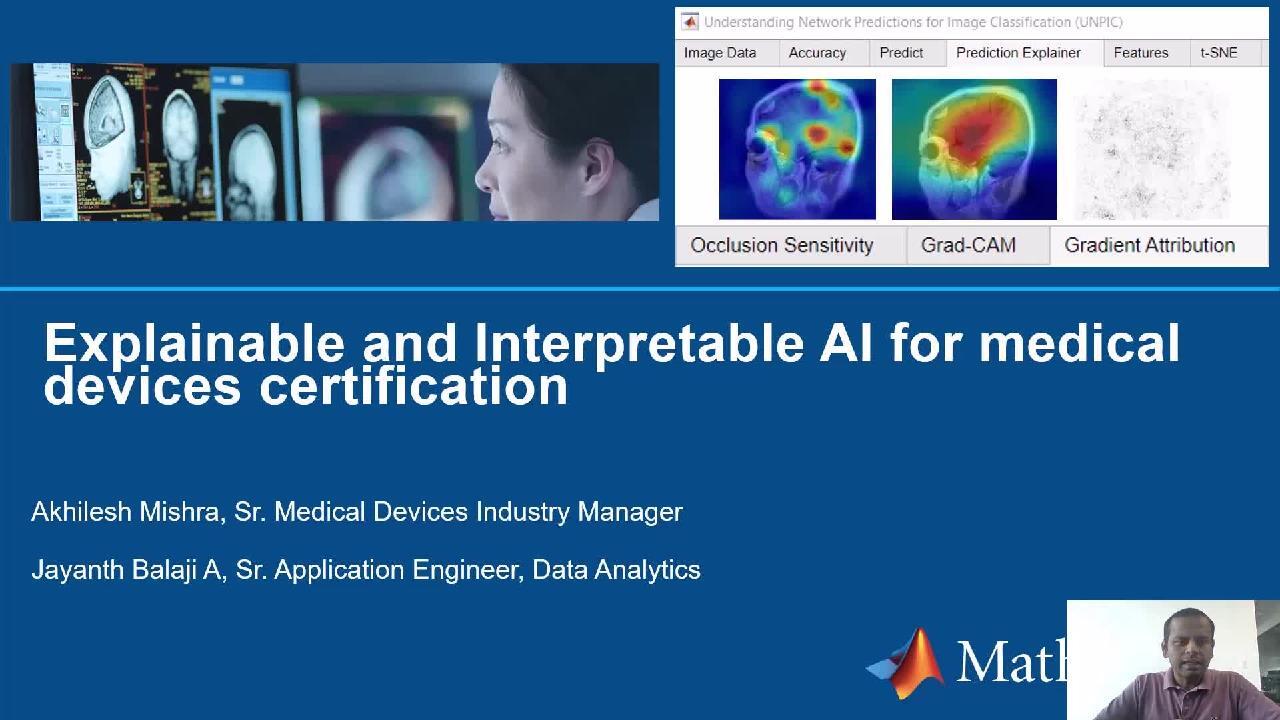
Explainable and Interpretable AI for medical device certification
Overview
In recent years, artificial intelligence (AI) has shown great promise in medicine and medical device applications. However, interpretability (or in deep learning, “Explainable AI”) requirements make AI applications difficult in the medical devices industry, due to strict regulation guidelines.
Interpretable machine learning provides techniques and algorithms that overcome the black-box nature of AI models. By revealing how various features contribute (or do not contribute) to predictions, you can validate that the model is using the right evidence for its predictions and reveal model biases that were not apparent during training.
In this session, we will demonstrate various interpretability methods available in MATLAB that overcome the black box nature of AI algorithms, useful for building/getting trust in machine learning and deep learning, and validating that models are working.
We’ll also explore the workflow for using artificial intelligence techniques to build digital health applications that comply with global medical regulations.
Highlights
- Choosing a method for interpretability based on type of data
- Applying interpretability methods to explain model predictions
- Explainable AI for Medical Images
- Certification workflows for medical AI
About the Presenter
Akhilesh Mishra is the global medical devices industry manager at MathWorks. In his current role, Akhilesh closely works with customers developing digital health and medical devices, academic researchers, and regulatory authorities to help them see the value of modeling and simulation and how people can leverage latest trends such as AI to build the next generation medical devices. Prior to MathWorks he was the signal processing lead in a group working on radar systems for sounding the ice sheets of Greenland and Antarctica to study global sea-level rise.
Jayanth Balaji Avanashilingam works as a Senior Application Engineer at MathWorks in the area of Artificial Intelligence. He primarily focuses on areas of Data Analytics for the application involving Time-Series data. Jayanth has around 8 years of research and industrial experience, where he was working developing AI/ML/DL solutions for various application areas, such as retail optimization, computer vision and Natural Language Processing. Prior to joining MathWorks Jayanth was working as Senior AI Engineer at Impact Analytics, Bangalore.
Recorded: 24 Aug 2023
Hi, everyone. My name is Akhilesh and I'm the Medical Devices Industry Manager. And first of all, I'd like to apologize for not being there in person to deliver this webinar, just because I'm based in the US and the time zone was not suitable for me. But let's get started on today's topic of Explainable and Interpretable AI for Medical Device Certification.
So first and foremost, all the stuff which we show today added these links ahead of time. So these slides would be shared after the webinar is over, and you can always refer back to these links for the examples and the stuff we show today. So before we get started, I just want to tell you we had this University of Dayton, they used deep learning explainability, some of our solutions to actually be able to tell like a particular X-ray being COVID or non-COVID, and then also give some explainable interpretation of why a particular image was being classified as COVID. So this is a good customer reference story if you'd like to take a look at it. I've got a link to the block here. Again, after the webinar you can take a look at that.
But anyways, what is explainable and interpretable AI? So obviously right now in medical devices we see a lot of AI being put there for a better result, for a better diagnosis, for aiding clinicians. And radiology is definitely one of those many areas where we have the maximum amount of AI being used.
But we all talk about the accuracy of the model. We talk about F1 scores of the model, right? And then we tell, yeah, the model is good. It's 98% or 99% accuracy and the F1 score is fantastic. The precision and all those parameters look good. But still, from a medical industry standpoint, if a certain decision is being made, the end user needs to understand why a certain decision was made, when we can consider it to fail, if there is an error how we can correct that, right? And explainable AI is those techniques which help you provide the hints of why AI is making a certain decision and also point out what are the AI weaknesses.
However, I would like to emphasize that whatever techniques we will be presenting today, these are just bits and pieces to achieve the good machine learning practice, which has been outlined by the FDA. But explainable AI cannot really fully convert that black box AI model, deep learning model, into white box, right? So it's just bits and pieces, moving parts which will help you get there.
So clinical practice expects-- and this is coming also from FDA and the good machine learning practice, like what AI algorithms should be capable of doing-- they need to improve the current existing state of the art, resolve any disagreement between AI and human expert, validate a better high performing algorithm, right? And then also a very important aspect is the AI model, whatever it is there in the clinical decision should be able to explain to the patient how these recommendations were derived, right? Why should we trust that model in first place?
And then very importantly from a legal standpoint, we need to mitigate any of the bad outcomes, right? So there shouldn't be any bias. If there is any chance of model being able to predict something wrong, then we need to have a mechanism to mitigate those bad outcomes. And as long as we get there, we are following the good machine learning practice again, highlighted by the FDA, and we should be in good shape.
So this is the proposed regulatory framework from the FDA. It came out, now it's two years almost. But one of the things if you take a look here, for AI models deployed in medical devices, what FDA is telling us is like, OK, they understand that not a single model would be 100% accurate. And as we collect new data from the field while the model is deployed, we need to have a mechanism in which we can track like the drift, track the model in itself, evaluate against some clinical baselines.
But then as we collect the new data, there needs to be a process for retraining the model and then redeploying it, right? So something similar to what you might have heard in MLOps. So that's like the total product lifecycle approach, which FDA recommends. But an important piece around this model training and tuning is validation, like how do we, as we are training, we also validate the models, right?
And that's something which MathWorks has kept a close eye on, whatever guidelines FDA is releasing, and we are trying to keep up with our tools and features inside our deep learning and machine learning solutions to be able to help you validate those algorithms. So anyways, after today's talk, there are a couple of workflows which we would like you to take away, is choosing a method of interpretability based on type of data. Definitely that you will take away from today.
Applying interpretability methods to explain model predictions. So not only just have AI model doing the prediction, but have additional insights into the model of why certain decision is made. And then one more thing I'd like to emphasize is the certification workflows for AI software as a medical device.
So we also have a comprehensive framework for VnV to achieve even the IEC 62304 or IEC 8204, or the software as a medical device certification, right? So with that, I'll open a poll, and maybe if you can put it in the Webex chat, what is your need for explainable AI models, like where you are coming from, and what would be that motivation factor why you would like to get your models verified.
So we will cover the following topics today, interpretability, explainability would be one. We will touch a little bit upon the bias detection and mitigation. And then finally, I'll give you the framework of VnV and certification where we have modified, based on the guidelines, what we receive from the medical industry, the V diagram for certification process, and modified it to a W diagram and kind of talk about how our tools meet that need.
So first and foremost, let's look into the interpretability and explainability part. So interpretability, explainability, there are a lot of techniques which we'll cover today. But using one example, I would like to highlight you some of those capabilities. So there is one problem where we need to identify like a signals data, ECG, trying to predict whether the ECG is like normal rhythm or an abnormal rhythm.
So for that, what we have is from we use a traditional technique. We have some features of six features which is related to the R wave, some parameters like RR0, RR1, RR2, and then a few ratios. And what we'll do is we'll train a deep learning machine learning model to make a classification as normal and abnormal. So with that, I'll pass it over to you, Jayant, to take over the example.
Thanks, Akhilesh, for a brief overview. So myself I'm Jayant. So I work as a Senior Application Engineer focusing on data analytics workflow at MathWorks. So what we understand from Akhilesh is like the problem statement is primarily focusing on issues of classification, out of which we have a certain feature that has been extracted from the raw data. And we will try to fit a model that can classify whether the ECG is normal or abnormal, right?
So for this workflow we quickly look into how MATLAB as a tool can accelerate your development of the process. So what we are going to see is, like one is how to efficiently fit the model with the minimalistic effort from your side. So in this particular case, as explained by Akhilesh, like it's a problem statement focusing on issues of classification. And for these issues of classification, we will be primarily focusing on how an app-based workflow for model-fitting can be applied or be efficiently deployed with the help of the tools inside MATLAB.
So just a quick review of the data, what we have right now, it's primarily on like multiple information, like on a 0 or a 1, and it's got corresponding classes. And we are, as we mentioned earlier, to start with, we are going to show you a workflow with app-driven things. So MATLAB comes with multiple apps to support the machine learning and the AI workflow. In this particular case, it's a classification problem statement.
So we are going to use the Classification Learner app. And we are trying to fit a model for our input data. So we are importing the data. And then we are specifying our inputs, which means like all the RR values and all those things. And the response we are selecting is output classification, which is whether the ECG is a normal or abnormal one.
Once the data is populated, this is a very interactive app. You can find list of algorithms that you can try it out, starting from decision trees all the way to a new shallow neural networks. So you are free to use one after the other and train the algorithm. For the sake of simplicity, I'm going to offload my work of algorithm exploration to this app.
So I'm clicking all the models to run, which means like multiple models will be trained on the data. And also I'm enabling parallel pool. I'll come to the point where I'm enabling parallel pool. So we have multiple algorithms, which is independent of each other, so that I don't want to wait every time to take a training happen on sequential mode.
That's the reason I'm enabling the parallel pool, which means algorithm training will happen parallelly. So I'm using a multi-core machine and I'm parallelizing all my algorithm or training process. In this case, you can see multiple algorithms trained in parallel, and its corresponding confusion matrix is projected as an output along with the accuracy metrics.
So I believe like most of the algorithm exploration will be writing the programmatic approach, but with this app you are offloading the algorithm exploration in app-driven mode. So it takes some time, depending upon the complexity of the data that you load in this particular app. In this case, it may take some few minutes. But we have accelerated the video.
But you can see the best-fit model is something around bagged trees, which is giving almost 99% of accuracy. We can also run the test data to get the inference how it is performing on the test data sets, which is unseen data from the training model. So in this case also, the test data is also giving us a certain reasonable accuracy, which is, again, around 99%.
On high level everything appears to be good. There is no challenge in developing a model, and quickly we use this app and we try out multiple algorithms, which is from the falling under these styles, machine learning workflow, and we are quickly able to fit the model. So just a takeaway from this workflow is you can able to quickly fit a model for your data, if you have the input and output response, and without you spending a lot of efforts on programming side. You are offloading the algorithm exploration with this app.
So here right from the data input all the way to model training, we have used an app-driven workflow. And once the model is trained, even we can able to take it for deployment. So that's the advantage of this app, right?
If the end user is interested on the programmatic side, so earlier we showed an app-based workflow. But if the end user is interested on the programmatic side, we also have a programmatic support. For example, I'm going to fit a few of the algorithms like trees in sample trees with a programmatic approach. It's a ready-made inbuilt function that is available in MATLAB. So you can able to specify the function, specify the input-output variables and its hyperparameter, and you can able to train it.
Even in this case, I'm enabling the parallel pool to parallelize my training process. So we can able to use these kind of mechanisms to offload or parallelize multiple algorithm training in this world. So here I'm fine-tuning my SVM. For example, the last segment of piece of code, it allows you to fine tune your SVM.
Here I'm fine tuning the hyperparameters. You can see the minimum errors and all those things, and also the objective function of it. So now what I'm doing is, let's load the trained model and let's test some of the accuracies of different models, medium trees, bagged trees, and also like Gaussian process.
So with this, what we are seeing is most of the model is giving us accuracy in terms of more than 99%. In some of the cases, even test data is 99%. So let's come to the point whether this is sufficient, and also a recap what we have done till now. Like we didn't focus on cleaning the data or feature engineering and things like that.
But we started directly from the clean data. But we have used an app-driven or a programmatic approach to fine-tune or select an algorithm that is best suitable for our data. And we could able to do that efficiently with help of app and inbuilt programming construct. With minimalistic effort we could able to finalize our models.
But do we think the job is done? When you ask about the data science world, of course, the job is done. But when it comes to real world implementation, especially in this case of going to the medical devices kind of a workflow, so the algorithm will be deployed on the devices, and it's very critical in nature, we cannot simply use the algorithm, because people have their own questions.
For instance, a few other things from what we point out here, like can we trust the decision from AI. If you recall, both the best case was 99%. Of course that is 1% which can be a misclassified interpretation or misclassified process. But the thing is that how they can trust the algorithm. That's one of the common questions, right?
So are they making fair decision, or the model can be verified. Or is it possible to monitor and debug the model. So those are the common questions that often comes from the domain side of a people. In this case, it can be a medical professional all the way to a system engineer, right? From the data science perspective, we could able to fit a model with a best accuracy that is possible, right?
But we are not here to answer the other side of the spectrum, like but how we can answer this is bringing the workflow, explaining the unexplainable AI models. So that's the common process we generally follow. And MathWorks supports multiple of these techniques, primarily focusing on interpretability and explainability, depending upon the type of models.
So in the case of simpler models, like linear models or decision trees, most of the time it is self-explanatory. For example, it may be a linear equation, or it can be a tree, which can be broken down into the nodes and how it is passing, so on and so forth, so that it's mostly directly interpretable models. But there are a few cases, which we will come to the point later, but let's focus.
If you recall a tree-based model is one of the things that came into our early algorithm development. Let's understand how it can be converted into interpretable workflows or explainable workflows, right? So first step is like we want to understand what is the importance of the predictors, which means the input variable that is going into the things, how it is contributing to other class predictions.
So for that we are going to use a predicted importance workflow, by which we are going to select our model. In this case, it can be a tree model which has a maximum accuracy in our case. And then we are going to compute the predictor importance for the tree model. And if you carefully notice, the predicted importance, which is giving the higher value to RR0, of course, it's a good one, but in the lower end, we can see the amplitude values is also coming up as one of the features, all right?
So this gives like some kind of an inference, because in theory, the amplitude of R should not affect the response. We can also take a look at the partial dependencies plot for one of the R amplitude values. And let's understand in detail, right? So our main concern with respect to this workflow is initially we understand the predictor importance workflow. And we find that R amplitude is contributing to the predictions.
So let's understand how our R amplitude is contributing to the predictions. When we look into the partial dependency plot of R amplitude value, we could able to see that there is at least a 5% increase in the actual value of probability of predicting an abnormal heartbeat, which is in this case, the class I, and that this is not in line with what we know in theory, and also reveals that there is a bias in our model, right? Like with the help of-- which is introduced by the R amplitude as a feature.
So what we can do is, let's try to remove the bias and try to understand or explain our theory based on what we know about the RR value and its predictions. So what we are going to do is we are going to remove these two features, primarily the R amplitude features, which introduce the bias. And we are going to retrain the model.
So in this case, again, you can able to use the models with help model training, with help of like app-based workflow, or programmatic workflow. In this context for the sake of simplicity, I'm just already trained the model and I'm trying to view or understand the model. So I'm just viewing the models. You can see that like a primary decision is taking, happening in RR0. And then it is traversing towards RR1, those kind of inference.
We can also have a textual reference for our model. Because it is a tree-based approach, you can see the conditions why it is taking or what of the traversing part it is taking before taking a decision, which means, at least in this context, we removed the bias, which is introduced by the R amplitude. And then we have retrained the model without bias. And once we try to infer the results, we could see that the decision is happening from the primary R input values, which is in this case RR0 and RR1, or RR values in general. And then it is traversing to make a decision.
So this is a simpler model we could able to explain with the help of a tree-based approach. Let us assume that instead of a simpler model, we want to use a bagged ensemble for deployment and medical software. The regulation dictates how important is it to understand how the model works at high level. We can determine the most important predictor, again, for this bagged approach, using the parameter predictor response function.
And we could able to understand how the predictor or the input response or input is affecting the output response. In this case, I have already trained the model, the complicated model, and I'm just viewing the predicted importance in this case. Interesting to note that the output of this, like predictive importance is very-- in the first like we used the predictor importance to understand the importance of the predictors.
And then let's also use partial dependency for the classification to get some further insights. So this is our RR1s predictor importance, one which you are sharing in the screen. It is interesting to note that how the input of this graph matches with the domain knowledge in this area. For example, variability in the RR intervals is highly associated with abnormal heartbeats, with a normal interval typically ranging from 0.6 to 1.2 second in range.
From our graph we precisely see that there is a probability drop significantly, based on the abnormal values, right? So at least like based on the RR values in this case, I'm just showing the RR1 like partial dependency plot. And there you can able to infer like if the value is less than somewhere around 0.5 or so, things like that, it is having a high probability of the score of 1, which is an inference with a theory where a typical RR interval varies from 0.6 to 1.2 seconds.
But in this case if there is something is changing within 0.5 seconds, then there is abnormal value, which in theory it is matching with our explainability of the models, right? We can also plot the partial dependency for the other classes like as zero, which is a normal class. And you can also see how the probability is shifting from the normal inputs.
And we can also view the partial dependency plots for other inputs as well to reinforce or to concrete our theory in validation with the model's predictions. So in this case, like we just use the tree in the initial things. But we can also use the same kind of approach for Gaussian models or SVMs, and we can also understand how the input values or partial dependency plot are helping us to infer the results from the data that is going to be predicted, right?
So here also I'm taking one of the inference tests to show how to validate it. So we have a probability score of 0.5 and above. We put a bar over there and we are trying to understand at what point it is getting changed with respect to the inputs of the particular values. So for example, there is something in RR1, within 0.5 region there is some change of significance, so that we can reinforce our validation with respect to the theory.
So let's understand what happens when the model is wrong. So instead of looking to the predicted as a whole across the entire data set, let's examine the individual predictions and see what factor is the most important for a specific prediction. So we are going to use a new function in this case, which is nothing but LIME or locally interpretable workflows. So what it is doing is, so it allows you to fit a simple linear model across a specific query point or a specific input.
And then you could able to validate the corrections. For example, here I'm fitting a simple model on top of my existing black box model and trying to infer the results for an individual query point. So the actual expected-- like for example like with this very popular model you can able to see the predictions, like how the input is also contributing and what is the prediction. In this case, both black box model and simple model give the prediction as zero. But actual prediction is 1, which means it should be something wrong with the data.
Let's infer from the results. You can also see RRZ is 0 value, which is 0.05 in this particular case. And if you go back to like kind of a partial dependency plot, and if you carefully examine the RRZ value by popping it out in this case-- I'm going to pop this figure out for more explainability, or to understand the inference from the plot-- so we could see that when the value is less than 0.5, it is having a highest probability score of making it as a class I prediction, which is abnormal in the case, right?
But even though the value of what we saw from the actual data is higher than 0.05, but the model is trying to predict it as 0, which also helps us to understand the individual points and also like whenever there is in this kind of a prediction is happening with respect to both a partial dependency plot and the v-line explainability, so the practitioner can come back and can be able to recheck those instance of values. So in concrete, in a sense like we could able to give some understanding of our predictions and why it is predicting in a wrong way, right?
So there may be a question like is it possible to trust LIME completely? But this is a workflow, which allows you to reinforce your predictions, or reinforce your understanding, all right? So in a way like you could able to consider this model as a grain of salt to understand the explainability how it is happening. So these are the methods to reinforce our predictions.
Let us now understand how this model makes a prediction for a specific observation, like what we are seeing in the recording. So taking a query point that is incorrectly classified by random forest, the true response is abnormal. But the model classifies the query point as normal, like heartbeat. We can use partial dependency plot, which we used earlier, to interpret the model prediction incorrect.
So in our setup for the normal heartbeat is positive class and abnormal heartbeat is negative class. That's what we want to understand. But from the partial dependency plot, we see RR1 gives a large positive contribution, driving the prediction to be classified as normal. On the other hand, RR0 gives a negative contribution and lowers the probability of the query point to be classified as normal.
The attribution of like RR1 is higher and hence the prediction for this query point is positive, right? So which means the RR1 has most of the importance to classify the prediction as normal. And this particular part is also inferring the same, and so that we can able to explain the interpretability.
So doing or work, we have seen this taking a signal-based approach. So we started with building some model, like it can be tree-based, simple tree, which is self-explanatory most of the time. And if it is a little more complex model, then we use a partial dependency plot to know how the individual predictor is affecting the prediction.
To reinforce the understanding, we use a LIME-based workflow, where an individual query point is used to understand the predictions. And we also validate if the prediction is going wrong, and how to infer it in comparison with your actual partial dependency plot. So that is purely a signal-based approach.
Let us assume that you have an image-based approach, for example, CT image or some kind of X-ray image and so on and so forth. So then the question comes like how you can able to infer. Well, like MathWorks again supports multiple of interpretability and explainability workflow for the kind of image-based workflow as well.
So a couple of examples I'm taking is like we have a workflow called as the grad-cam, which shows the area of image that contributes mostly to the classification. For example, in this class if you want to classify the chest X-ray and where it is focusing, where the algorithm is focusing, you could able to make the inference with this grad-cam workflow, so that you can able to justify whether your algorithm is focusing on a right point for our classifications, right?
So that is one of the techniques. Even the same grad-cam, not alone applied for like kind of an image-based data, for like X-ray image what we have seen earlier, it can also be applied to time series data. So for example, even for same like kind of a ECG classification, you could able to apply grad-cam and you can see which are the segments that it's focusing on, making a classification of a workflow. In a way, like if you actually look at the plot at the right, like the original signal with the grad-cam map, the high values of grad-cam map corresponding to the fragments of signal driving the predictions into the arrhythmia classes.
So in a way, like our algorithm is focusing on expected inputs, and it's trying to give a prediction class. So these are some of the examples. And we have some more examples in a part of our shipping things, like occlusion sensitivity, then LIME and also like visualizing the deep learning networks activations and so on and so forth.
So depending upon the type of data and how you want to have the explainability, you can able to decide on the choice. So in this particular case, I'm just showing a workflow or kind of a classification workflow. For example, depending upon like inherent explanation if you need, which means either you can use a linear model or a tree-based approach or if it is OK to have some kind of a local behavior explanation, then you can able to use shapely and things like that.
Or if you want to have a global explainability or interpretability to your machine learning model, then we can get into the feature importance and partial dependency plots which we have seen earlier. So this is primarily focusing on interpretability and explainability support, that what we have within our tool, we have discussed about time series as well as the image-based workflows.
There is one other important thing, which is kind of a bias in the data. So for example, whether we have considered all the scenarios or all the classes while capturing the data, which is used for training the model, if we do not consider there is a high chance or high probability that bias in the data collection itself can affect your prediction or model training. So let's carefully, in the next few slides, we can look into how this bias mitigation, bias can be detected and mitigation can be done, right?
So there are multiple sources of bias. For example, it can be not enough data from a specific source. So that is by default by data selection itself, there is a bias introduced, right? Or there can be like a behavior-based bias and so on and so forth. So let's focus on how we can able to get into these workflows, because end of the day, fairness contributes to the responsibility and detecting and mitigation of the bias against unprivileged group in the ML modeling or the AI modeling is highly recommended.
So for example use case, we are taking some of the cases that have some class imbalance or bias introduced in the data. If you build a model with those information, then your algorithm is also highly susceptible to the bias, and it can able to skew the results in prediction, or it may not be trusted as an appropriate kind of a prediction. So this is also one of the important workflows in the verification validation of AI models.
So how we can do it? First of all, like we want to consider the disparity workflows. We want to understand how the data is being captured, and we want to detect the fairness or detecting the data in the workflows. To support this, in MathWorks, what we have is we could be able to calculate the disparity informations. For example, parity difference, statistical parity difference, we can compute the parity difference for each group by which the data is being captured. And we could able to extract the weights, the kind of fairness weights, which can be used to retrain the models or refine the model training itself.
So just to give a context, so we compute the statistical parity difference for each group of different things in the data. For this case, it can be like a different gendered kind of a workflow, where a male and female gender you are capturing, trying to capture the information for certain things. And that we will understand the statistical parity difference of each group and sensitivity to this attribute. And then we build fairness weights, and we use these fairness weights to retrain or refine the model training itself.
In a way we are eliminating the parity difference or eliminating like a kind of disparities. So for this case, we are taking a case of a male and female data. And we try to understand the kind of like fairness score or kind of a statistical parity difference. And then we recalibrate the weights. And then we use it for retraining of the model.
In a way we will eliminate the bias in the workflows. So in multiple other ways, like the bias, and bias can be detected and mitigation can be done. For example, if you want to do it in the pre-processing stage itself, we can remove the information correlated to the sensitive attribute. And then we can retrain the model so that you are removing the bias.
In the processing, like for example, as we said, like we add, as we showed earlier, like we could able to use a fairness weights. Then we can be able to retrain the model and regularization terms to the objectives. In post-processing also we can edit the posteriors to satisfy the fairness constraints. In that way, we can also eliminate the direct bias and also eliminate the bias in training.
For these two areas, certain products are proper, these two are the certain things which we discussed earlier, which is also important to get into the workflow as Akhilesh mentioned. So right now we covered interpretability, explainability, and bias mitigation workflows. Now I will hand it over to Akhilesh to cover the verification and validation piece.
Thank you, Jayant, for walking us through the various techniques in the interpretability, explainability, the bias detection and mitigation. So now let's cover the last piece of this today's talk of verification, validation, and certification. So remember, I said in the beginning like we have some framework for certifying your AI-enabled medical device. And this is what I'd like to cover in the next few minutes.
So traditional medical development workflow, like IEC 62304, and most of us might have seen this V diagram. So we want to start with some requirement analysis of what software we're developing, get a high level design, move it to the implementation phase, and then from implementation we go on to its testing. So we are doing testing in parallel. When we do the high level design we are doing testing in parallel, low level design, and then get to the phase of integration and system testing, right?
So an example, just the example, which Jayant showed earlier, ECG classification would follow like a 62304 standard, right? But when AI is in loop, there is a new proposal out there. And this is kind of going on in parallel with medical industry as well as the aerospace industry. So what they are telling us is like, hey, rather than the V curve, we need to adopt this V curve and have a new W diagram implemented, to incorporate the AI components verification.
The non-AI verification, non-AI components of that software, still follow the V diagram. We go through the design, go through the testing. But for AI components, we can go with the W diagram. And what we start is like we start with the requirements. And the requirements for AI are specific to AI, right? Like starting even from accuracy, precision, F1 scores, the metrics, and then what we are classifying. And then if there's let's say some feature extraction steps, then what is expected out of that feature extraction step, and so on and so forth, right?
Then comes the data management. We train against a lot of patient data. So having a mechanism to better manage all that patient data, and as we collect new data, how we kind of stream it back in in the new learning process. So all of that comes into display.
Learning process management, in terms of the types of model we train, how do we optimize the hyperparameters, is one model good enough, or do we want to train multiple models and pick and choose which model works the best, and so on and so forth. We perform the model training, but the key is this learning process verification kind of comes in in between the model training and when we go to the implementation phase.
And while we are training, while we are coming out with various designs, is there a way to constantly verify the model we're training? That is something which FDA wants us to do, right? And then once we have the implementation done, then we can write more test cases, do the ML requirements, verification, write whatever requirements we have. Are we satisfying that? And then take our model towards implementation.
And in MathWorks, just as a side note for implementation, it can mean a lot of things. But taking our model, generating, converting it into the C code, C++ code, or even putting AI models in FPGAs, it's something that we support out of the box. But not only that, if you have enterprise-level deployment, let's say you want to put your AI models in a cloud system or some sort of a hospital app, which is deployed in a hospital server system. So we have capabilities on generating a microservice or like a docker container application of your AI model and deploying it at the customer site.
So this W diagram, we do have a very detailed demo on this whole W diagram, walking through each and every step of this diagram with an example use case of a COVID-detection algorithm. So if you're interested in the demo of that whole W diagram, please let us know in the chat. We will be happy to follow up with you and run a dedicated-- like a session with you on just doing this whole V&V for an AI model.
And keep in mind, it can be anything, machine learning or deep learning. So this W diagram is kind of adoption adaptation from what, again, the reminder is what FDA had recommended. So remember, going back to the good machine learning practice, they told us like, OK, model training and tuning and the model validation step should be in parallel when we do the training, when we do the training and the tuning as we get new data. And then we push out the new deployed model, the best model out, and then kind of keep going on in this fashion, right? So the TPLC or the Total Product Lifecycle Approach, this is how it is implemented.
So whenever we go to the FDA, and this is the kind of the framework we are following, I think FDA is very happy to see something of this sort. So Jayant talked about explainability, and some bias mitigation. So all of that actually falls under this model validation step, right? There's another validation step as a part of that W diagram. Another piece, which comes a lot in the medical industry, is adversarial attacks, which is another angle of how do we get some more explainability in our model and how do we prevent and mitigate one of these risks, right?
So this is one image, which was I saw it in a conference from FDA a few years back, and there's like an AI model is detecting an image as panda, but then you add noise to it. And then suddenly it misclassifies that image. And then the confidence level of the score is so high, right? So how do you prevent your model against that?
So that's another, this learning process verification tool which MathWorks has given. And what we have given is we have given a formal method of verification, where let's say whenever you're doing training any models, you can add perturbations to your model. And then you can verify the robustness of your model. And what it will give you is insights if the model is verified, it's unproven, or violated.
And the way we do that is after adding perturbation, so layer after layer in deep learning, there's an over-approximation function. And if our final classification falls in one of the decision boundaries, and we are confirmed that the perturbation is not going to affect the classification of the model, those are the conditions which we call as verified. But then the one which we are sure that the perturbation will cause a misclassification, we can tell the end user that, hey, do not trust this decision, because it is violating some of the rules, or the arithmetics is violating some of the decision boundaries, when the perturbation is added.
And for unknown, we also give that, OK, this is probably the intersection of the two decision boundaries. So we don't know what to tell. So this is, again, from a clinical standpoint, it's giving you insights when to trust a model and when not to trust a certain decision. So that's one of the applications, like OK, now when you get a new data, do you want to trust this? Or is this particular image or this particular patient use case prone to adversarial attacks, because of the perturbation will lead to a misclassification?
But in addition to that, it also gives us during the training process, how we can better train models. So we have an example, and we'll be happy to share it with you-- just put it in the chat-- is original network when we ran this formal verification, it was giving us a lot of the results were unproven. Like we had I think almost a total of 700, 600 cases, of we are classifying an image. The same COVID detection example was unproven.
But when we used some augmented model where we had data augmentation applied, we got some better results. Unproven went down. Some of the results were verified. Notice that before doing anything to the original network, we had no results which were verified. So basically the model, original model, was fully prone to adversarial attacks.
But then we have more capabilities inside our toolbox. You can train robust networks, train adversarial by using generative adversarial networks, like GANs. You can train robust networks. So we use the same data set with the robust network strategy, and then all of a sudden we have 400 test cases which were verified, and then less amount of test cases which were unproven or violated.
So it is giving us insights, algorithm developers, how we train more better adversarial, you know, shield our networks from adversarial attacks, and same kind of stats, same kind of arithmetics, is also given the approvals, the certification agencies, more confidence in the AI model which we put out there. Anyway, so I'll stop for a few seconds for a quick one more poll. Are your model explainability and interpretability properties sufficient in your current AI framework? You can just put yes and no, because the reason why I have this question right now is we saw so many techniques today, like shapely, LIME, grad-cam, this verification of adversarial attacks, and then that whole V diagram, modified W diagram for 62304 certification.
So when do we say the explainability and interpretability is enough, right? So that's an open question. Sometimes we don't want that much of detail. Sometimes even with so much explainability, still it's not enough, right? So this would be a good question to think about.
But anyways, so the last few slides I have here is going back to the W diagram and the V diagram. So the V diagram was the 62304. We do have tools to actually implement the full 62304 life cycle for AI models. We're not showing it today in the interest of time. But you can actually link your formal requirements.
Even if you have requirements in other tools like JAMA, IBM Doors, or even if you're working out of a Word document, Excel document, but you can bring those requirements in MATLAB. You link those requirements with your implementation. You can test, implement, like you can write test cases for all your requirements for AI models, like what's going to be the accuracy. What should be the precision? What should be expected out of features? What should be the activations, results for each and every layer.
So you can build all sorts of test cases. How do you verify your robustness? What is the SNR or what is the signal to noise ratio, which will be that threshold for your robustness verification. So you can build all those test cases. And then we have the mechanism to generate C code, C++ code, or put them as a microservice or a container image on the cloud for deployment.
So we have the full end-to-end V&V workflow. And as you're going along from requirements to deployment, you will be generating those reports and artifacts which can be included in your 510K documents or other archiving documents, right? But one important thing, like this is a busy slide, but one important thing I'd like to mention is everything is traceable.
So when you get those reports you'll see that the final firmware code, every single line of code which gets generated, has linked back to the requirements. You can trace it back to the requirements where it started. You can link back every line of the C code, C++ code, or even the deployment code, which you generated with the test cases. And then you can kind of report more metrics on how much is the coverage, is fully 100% code fully covered with the test cases. If not, then do you need some additional test cases to show that coverage, so on and so forth.
So it gives you a very streamlined mechanism and a framework for doing the full V&V, not just any algorithm, but also inclusive of AI algorithm, which becomes part of the software as a medical device. So with that, the last thing is certification for AI is still in the early stages. We keep getting more guidances. We keep getting more guidelines from FDA.
And we do partner with FDA. FDA is also like one of our customers. They use our tools a lot for doing some of these V&V activities for the submissions they get. Not saying that they would ever promote like, hey, use MATLAB or other tool. They're agnostic to that. But because MATLAB has this framework of those test cases, the verification is done on the actual deployed code or the version which goes in the device. So it makes it a lot more streamlined, right?
So with that, I'll just leave you guys with some more information links. We have some really good interactive tutorials, on-ramps like to get things started. There's deep learning on-ramps, machine learning on-ramps, image processing on-ramps. So these are free training. Please leverage that. And then there are some more trainings. If you are interested in some trainings please do let us know.
And last but not the least, we do have offers for you, so you can get started with some trial licenses if you want to try out some of these explainability and interpretability capabilities. But then also reach out to us directly or put your contact in the chat. If you'd like us to reach out to you to get you started with some of these capabilities and get you going with your explainability and interpretability needs.
So with that, thank you very much for attending this session today. I'll pass it over back to Jayant for any Q and A's or questions we want to take up right now. Thank you very much.
Featured Product
MATLAB
Up Next:


Related Videos:


Select a Web Site
Choose a web site to get translated content where available and see local events and offers. Based on your location, we recommend that you select: United States.
You can also select a web site from the following list
Americas
- América Latina (Español)
- Canada (English)
- United States (English)
Europe
- Belgium (English)
- Denmark (English)
- Deutschland (Deutsch)
- España (Español)
- Finland (English)
- France (Français)
- Ireland (English)
- Italia (Italiano)
- Luxembourg (English)
- Netherlands (English)
- Norway (English)
- Österreich (Deutsch)
- Portugal (English)
- Sweden (English)
- Switzerland
- United Kingdom (English)