Foreign Economic Policy Uncertainty and US Equity Returns
Mohammad R. Jahan-Parvar, Federal Reserve Board
This talk highlights how we document the predictive ability and economic significance of foreign economic policy uncertainty for US equity returns. After orthogonalizing global economic policy uncertainty (EPU) with respect to the US EPU, we find that it has significant predictive power for aggregate stock returns and returns of portfolios constructed on size, investment, capital expenditure, and foreign sales when forecasting 6 to 12 months out. For individual companies, we show that foreign EPU commands an economically significant and negative-valued premium in the cross-section of returns. The stocks of firms that are highly sensitive to foreign EPU, whether positive or negative, outperform those that are less sensitive to this measure.
Published: 7 Nov 2023
Thank you very much, and thank you for the invitation. So it's going to be a slight change of gear here. This is not a technical paper that I'm going to present. This is like in a straight up finance. So the usual disclaimer applies since this is work done by Federal Reserve system. So please do not call Jay Powell and said, Mohamed said so and so. This is joint work with Yuriy Kitsul, Jamil Abdul Rahman, who used to be our RA here at the board and is now at Yale, and Beth Anne Wilson also at the board.
So the basic question is that the standard asset pricing theory implies that market volatility contains all the information needed for the risk return tradeoff analysis. So typically what people have done is that they looked at historical, realized vol. People also have looked at option implied vol And more recently, people looked at the variance risk premium.
Then there is another confounding factor that whether when you are looking at different measures of risk, is it really, you're looking at the risk, or are you looking at uncertainty as it is defined increasingly in macro models that they look at uncertainty stemming from different parts of the economy? Or is it straight up knightian uncertainty. You just do not know which probability law you are looking at.
So the basic question is that are there other aspects of risk that are captured by measures, other than the financial market volatility? So Baker, Bloom, and Davis introduced the news-based measure uncertainty about economic policy decisions, which they call EPU. Now remember that EPU is not a risk measure, it is not a volatility measure, it speaks to some sort of economic uncertainty gleaned from non-financial or non-numerical data.
So instead, a series of studies such as Pastor and Veronesi early on, and then later Brogaard and Detzel, and then followed up by many others showed that the US economic uncertainty has predictive power for the equity returns. And aligned with the impact of US News, whether it is monetary, fiscal, or political to the rest of the world as shown by Miranda Agrippino and Rey in 2022 and with others. And earlier studies such as Boutchkova and coauthors, and more recently, Brogaard and coauthors that argue that the direction of political information or policy information is from the US to the rest of the world.
Now the question is, can the reverse of it also be true? That is, if you have an interconnected world, do foreign economic or political uncertainty also affect the US asset prices? Now why are we interested? With the rise of globalization at least until 2020, we do expect a foreign economic policy uncertainty to affect businesses and their equity returns as a result.
For example, the European debt crisis, Brexit, and the US China trade disputes in 2017, actually did affect US equity returns. And moreover, as part of our job, we have to talk to analysts and market practitioners. They do mention foreign EPU as a factor affecting US returns. So economic research has not really considered this channel.
Now does US EPU, or does foreign EPU have predictive power for US returns? If so, then we are interested in the predictability horizon, when does it kick in, at aggregate level, which portfolios are sensitive to global EPU, and what are the channels of transmission. So again, there is interest in time series aspects, such as sign, size, and significance of predictability, predictability horizon, and transmission channels, and potential spillovers to the real side of economy, for example, and an investment or employment numbers.
So to summarize what we have found is that at the aggregate level global EPU is more concentrated in larger companies. However, market by the mid-cap indices are also predictable, which means that there is a sizeable component of mid-sized companies that may actually be also effective.
The predictive window is in excess of six months, typically concentrated in 9 to 12 months ahead. And in addition to size, which I mentioned earlier, other factors, such as investment factor, operating profitability, idiosyncratic variance, CapEx expenditure or foreign sales are also identifiers of portfolios that are sensitive to changes in foreign economic policy uncertainty.
We are working on channels of transmission to macroeconomic variables, and we'll readapt the paper shortly. So I'm going to skip the literature review. So the sample period that we really considered was from 1997 to June of 2021. And it is, we looked at S&P 500 returns, the broad CRSP value weighted, NASDAQ, Russell 2000. Risk free rate is the one month Treasury Bill rate, in line with the monthly analysis that we are going to look at.
And you have the Fama and French 49 portfolio for industries, and other factors gleaned from Fama and French library compustat or the other usual suspects. So when we are talking about the industry uncertainty measures, we are using the US and the global EPU from Baker and Bl-- Baker, Bloom and Davis, and the data set that they maintain. Now the problem is that the global EPU loads very heavily on us information. So we have to do something about that. And since we are going to form portfolios, then we need to actually, you cannot use EPU g directly.
So what we do is that we took the residual of the EPU g regressed on US EPU, such that the effects of the US are taken. We take the residual carried foreign EPU, which is going to be, which is by construction orthogonal to US EPU. OK? And we tried that also with lag values. The results are, actually, even not quantitatively that different with one lag, one month lag. So we are sticking with this contemporaneous regression.
The update that, so essentially, we update that as we build the regressions, such that they do not have a look ahead bias. So if visually, you want to see how things look like, the blue line is the US EPU, the red line is the foreign EPU, the orthogonalized part, and the dashed line is the global EPU of Baker, Bloom, and Davis. And here is the histogram for the results, so you see that it is actually not symmetrically distributed.
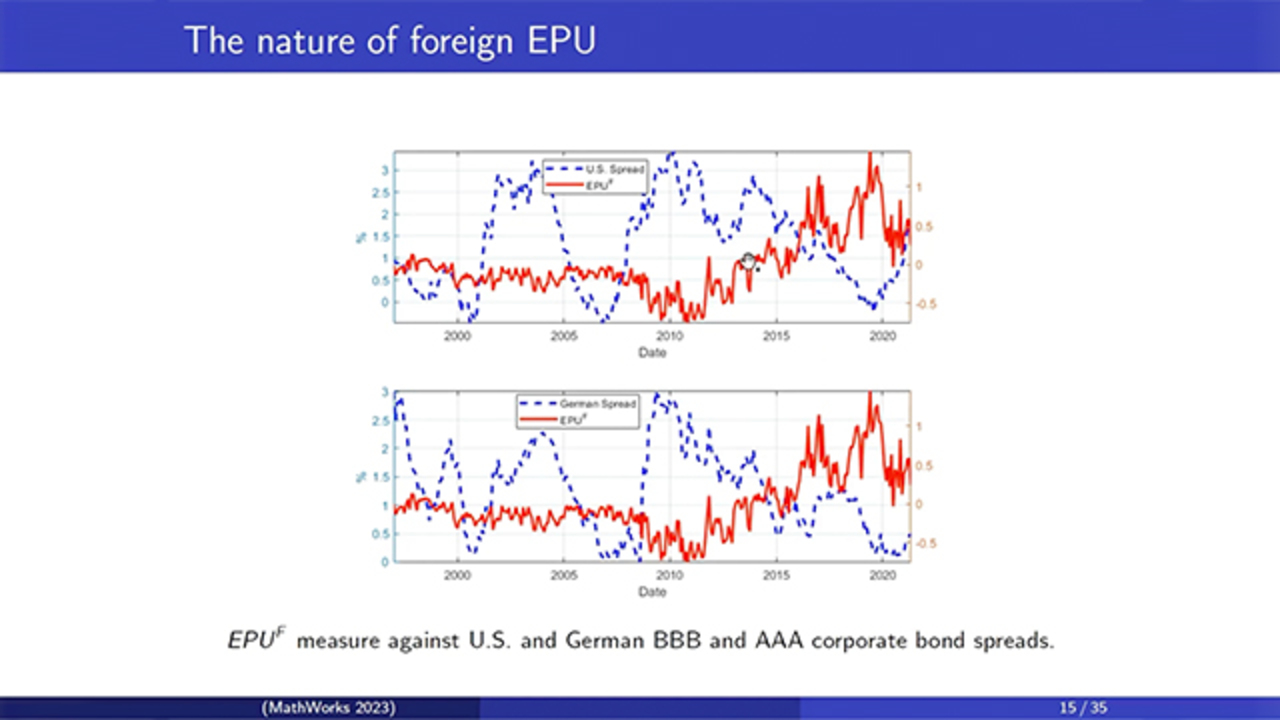
Now you want to validate the EPU measure. So the foreign EPU measure, we look at contemporaneous to about nine months ahead, predictive regressions, with respect to VIX, US spreads. It is negatively correlated with US spreads. With US log price dividend ratio, it is not correlated.
It is independent of the Chicago Fed's CFNAI measure, and it is negatively correlated with German spreads and Baltic Dry Index. OK? I'm going to skip the other two because that's a repetition, and it is very similar results. And if you want to get a figure of how one year Treasury bond, US EPU, and the foreign EPU, I did it in red. Look, this is the relationship that you get until the end of 2021. OK.
And you also want to look at the spreads between the triple B, and triple A corporate bond spreads, and which is essentially a default measure. So this is the relationship between US and foreign EPU and the German spreads. So again, you see that as the, particularly after 2008, as the spreads rise, EPU also rises. As the spreads fall, EPU rises, that which essentially means that, essentially means that the correlation is not just a fear about, the contemporaneous correlation, is not a fear about just the level of uncertainty on the corporate side. It captures something else.
OK. So what is the data that here, which is the model that we are going to consider? We are going to consider this model, which essentially, you have US EPU, the foreign EPU, and a set of factors or control variables. There is a large set of them, and that we try to use to forecast, is to predict, not forecast. Predict cumulative excess returns at the aggregate level. We use the same thing for portfolio returns later, and I'll show you how we do that.
OK. So if you want to look, here is the results for CRSP, S&P 500, and NASDAQ. And you see that as for the foreign EPU, once you have the control variables, the results for CRSP only really kick in the longer end of the prediction window. For the S&P 500, they show anywhere between, it's 9 to 12 months. And the same is also true for NASDAQ with the difference that it also shows something for the six months. If you do not have the control variables, the results are a little bit stronger for NASDAQ.
OK. So what are the, so based on this, we know that there is some predictability, particularly in the longer windows for aggregate returns. Now the question would be that, what are the characteristics of the firms that are sensitive to these EPU measures? So what we do is that we look at all the firms in CRSP compustat universe, and we do a combination of using the Foma and French built portfolios, but we also build a couple of portfolios of our own.
So for example, if you want to look at the single sort on size and book to market ratios based on Fama and French portfolio, reported portfolios, you see that effect that foreign EPU has predictive power for the high end, like the top 30% of companies, for longer periods after six months survives, and it is there. Surprisingly, also has some result for the smaller companies.
For the book to market ratio, this predictability is essentially concentrated for low book to market companies. And the difference, again, is present for the low, it is driven by the results for the low book to market. OK.
If you want to look at investment and operating profitability, so essentially saying that the size is not the only thing driving the results, and we get the same, we get the same thing. That high investment, high operating profitability companies tend to be predictable by EPU s for the longer horizons. And the result is not present for low profitability, low investment companies.
The difference is significantly predicted. So essentially, if you go, if you actually invest, if you have a portfolio, a trading strategy, that is trading when you have high EPU. You actually sell the affected companies, you actually make money here. OK.
So we also want to see that, I also mentioned idiosyncratic volatility. And companies with high idiosyncratic volatility put in the highest 20% of them, are predictable by EPU foreign. And the result survives if you also sort on size and idiosyncratic vol. And again, the strategy that will shorten the low impact companies is significantly returns a significant return to you. OK.
So you also want to talk about, we also wanted to look at this type of companies that are low or high on cash flows. So the companies that have high cash flows actually are not affected by the foreign EPU, but the cash flow constrained companies seem to be highly predictable by EPU measure. And here, kind of the reverse actually works, that this result is, apparently, this result is independent of size.
So it is, cash flow itself seems to predict, to be predictable, but once you actually sort and size the cash flow, there's [AUDIO OUT] a lot. OK. These are new [AUDIO OUT]. This file is nothing at all. And [AUDIO OUT].
What they did was that it also had to build portfolios, so we did that. And single source companies on foreign sales. Again, are predictable in the longer end. And the difference once you double sort on size and foreign sells shows that large companies that are highly exposed to foreign, to foreign sales are highly predictable by EPU f, by the foreign economic policy uncertainty. This is not an unexpected result, but it is nice to have it such that it is documented.
Now similarly, we wanted to see that, what is the relationship between CapEx expenditure and capital expenditure, and EPU f? Not very surprisingly in the kind of companies that are highly exposed to, so they have large capital expenditure outlays, are predictable by EPU f. And this result is more pronounced for the larger companies.
So that is to say, if you're buying a company with high foreign sales and high capital expenditure, you are likely to be affected in your stock is going to be predictable. The movements of your stock are predictable by changes in the EPU f over the long periods. Remember that's how this thing works. That's like an impact of the shock, the price of the stock drops. So what you're looking at is the equity premium predictability. The price drops on the impact as foreign policy uncertainty goes up, then it recovers, and that is what is predictable.
OK. So that's the summary of what I mentioned to you so far. Then what's going to be the question of the transmission? So the big question usually is it a cash flow or a discount rate transmission on Campbell and Shiller? Or if we look at the more recent, more recent developments in the literature, you can also think about more refined decomposition of the returns based on the driving shocks using, for example, Ciselak and Pang's four factor sign restricted VAR.
So we can both look at the Campbell and Schiller, and the four shock decomposition, and this is the results that we get. So if you go by the two shock Campbell and Schiller, the predictability that you get is on the discount rate. If you go by four shock of the Ciselak and Pang, or the equivalent two shock of Ciselak and Pang that does the cash flow and discount rates, you get a more reasonable result in some sense.
Because I personally have a hard time thinking about that foreign shocks are going to actually change the discount rate of the US investors by very much, but it is not that hard to believe that foreign shocks are going to be, going to affect the cash flow of the US companies that are exposed to foreign markets. These results are very much in line with the predictability that we already saw in the analysis, and these are essentially the same constituent shocks that actually derive the S&P 500.
So the results that you see are actually for S&P 500, showing that drove shocks within S&P 500 are predictable by at 9 to 12 periods ahead, and the cash flow shocks growth being a proxy for cash flow to a large part are also predictable for the S&P 500, and by EPU f, and again, 9 to 12 periods.
Now unfortunately, I couldn't finish the work that I was doing for the transmission to the real site. Specifically, we were looking at a employment data that companies report, and their capital expenditure outlays, whether the actual numbers are predictable by EPU f. That should be finished soon, and then we want to also have, then we can say a little bit more about the transmission to the real site.
Now on the cross-sectional side, we are looking at a Fama Macbeth regressions. In order since neither EPU or EPUf are traded variables, they are not traded assets, we built factor mimicking portfolios, and they seem to be reasonably correlated with the usual suspects that you see in the literature following, the methodology is following Breeden and coauthors.
OK, so I'm going to show you the usual Fama-MacBeth two stage. And these are the estimated premiums per month from the second stage and for the EPU f, they seem to be reasonably, they have the usual negative sign and they are statistically significant. So in conclusion, and I believe that I'm going to let you go right before lunch, which is a good, which is a good plan, is that we have extended the evidence presented by Pastor and Veronesi, and Brogaard and Detzel among others to international sources of economic uncertainty and it is [INAUDIBLE]
So for large to mid-cap companies, particularly those that are more exposed to foreign events, you have predictability between 6 to 12 months ahead. And the flow of information appears to be mainly through the cash flow for these companies. And factors such as size, capital expenditure, foreign sales and profitability appear to be important identifiers. This is the presentation. Thank you very much for listening.


Select a Web Site
Choose a web site to get translated content where available and see local events and offers. Based on your location, we recommend that you select: United States.
You can also select a web site from the following list
Americas
- América Latina (Español)
- Canada (English)
- United States (English)
Europe
- Belgium (English)
- Denmark (English)
- Deutschland (Deutsch)
- España (Español)
- Finland (English)
- France (Français)
- Ireland (English)
- Italia (Italiano)
- Luxembourg (English)
- Netherlands (English)
- Norway (English)
- Österreich (Deutsch)
- Portugal (English)
- Sweden (English)
- Switzerland
- United Kingdom (English)