How to Develop a Machine Learning Classifier with MATLAB
From the series: “How To” Video Series for Biomedical and Pharmaceutical Applications
Using features extracted from signals collected from an endoscopic fluorescence imaging system, use Statistics and Machine Learning Toolbox™ to develop a machine learning classifier to discriminate normal tissue from cancerous tissue. The Classification Learner app lets you perform common supervised learning tasks such as interactively exploring data, ranking and selecting features, specifying validation schemes, training and optimizing models, and assessing results. Generate the corresponding MATLAB® code, or export classification models for use in MATLAB or integration into deployed devices and applications.
Published: 19 Jun 2023
Hello, everyone, Paul here from MathWorks. Today I'm going to show you how you can use the Classification Learner App to interactively train and validate a machine-learning model. In this example, we'll use signals extracted from an endoscopic fluorescence imaging system to develop a classifier to discriminate normal tissue from cancerous tissue.
With a traditional approach, we'd write a computer program to process our input data to compute a desired output. With supervised machine learning, this is flipped around. We feed an input data along with the corresponding expected output, and the computer creates a predictive model. As such, the inputs are often referred to as predictors or features, and the outputs as the response or labels.
You may recall from my previous how-to videos that this fluorescence imaging system simultaneously captures and displays videos in both the visible white light and near-infrared spectrums. The Fluorescent Tracker App you see here has been updated to easily extract and label intensity time histories across a grid of regions. Since we'll be using supervised learning to train our classifier, we'll need to label the known biopsy responses for each grid region using our training and testing data sets.
We'll then process the video to extract the fluorescence intensity time histories for each grid region. As seen in this false color overlay, when used with an injection of indocyanine green fluorescent dye into the bloodstream, this system offers an effective way for clinicians to visualize blood perfusion, as the dye becomes fluorescent when excited by near-infrared light. A team at the University College Dublin Center for Precision Surgery is researching if changes in the fluorescence intensity that result from variations in the dye absorption can be used to discriminate normal tissue from cancerous tissue.
Once processing completes, we can use the Save button to export the intensity time histories and region labels to the MATLAB workspace. We can then use the region labels to quickly visualize potential differences in their intensity time histories. The UCD research team has observed statistically-significant differences in features related to the intensity wrapup and decay signatures.
For example, for each label, the region will extract the following features, the base intensity value before dye absorption, the peak intensity value, the time to half and full peak, and the intensity values at 50, 100, and 145 seconds after the peak occurs.
The above process was repeated for a total of 22 patients. We'll use 20 of the videos for training-- 10 with cancer and 10 without-- and set aside two videos for testing, one with cancer and one without. On average, each video labeled about a dozen grid regions, resulting in a training data set with 128 cancer regions and 128 negative regions. Negative regions were collected from all videos, with an even mix of benign lesions and healthy tissue.
With our labeled training and test data loaded into the workspace, we're ready to begin developing a classifier. After opening the Classification Learner App from the Apps tab, we'll create a new session using our table of training data. We'll use cross-validation to protect against overfitting, and we've already set aside a separate table of test data.
Two common challenges in machine learning are feature selection and choosing a model. In this case, we've only included a few features, but there are many others we could have considered. The Classification Learner App includes a variety of feature-ranking algorithms to help you understand and select the most important features. Similarly, with so many models to choose from, it can be difficult to know where to begin. As such, we'll start by training them all and then use the cross-validation accuracy to evaluate their relative performance.
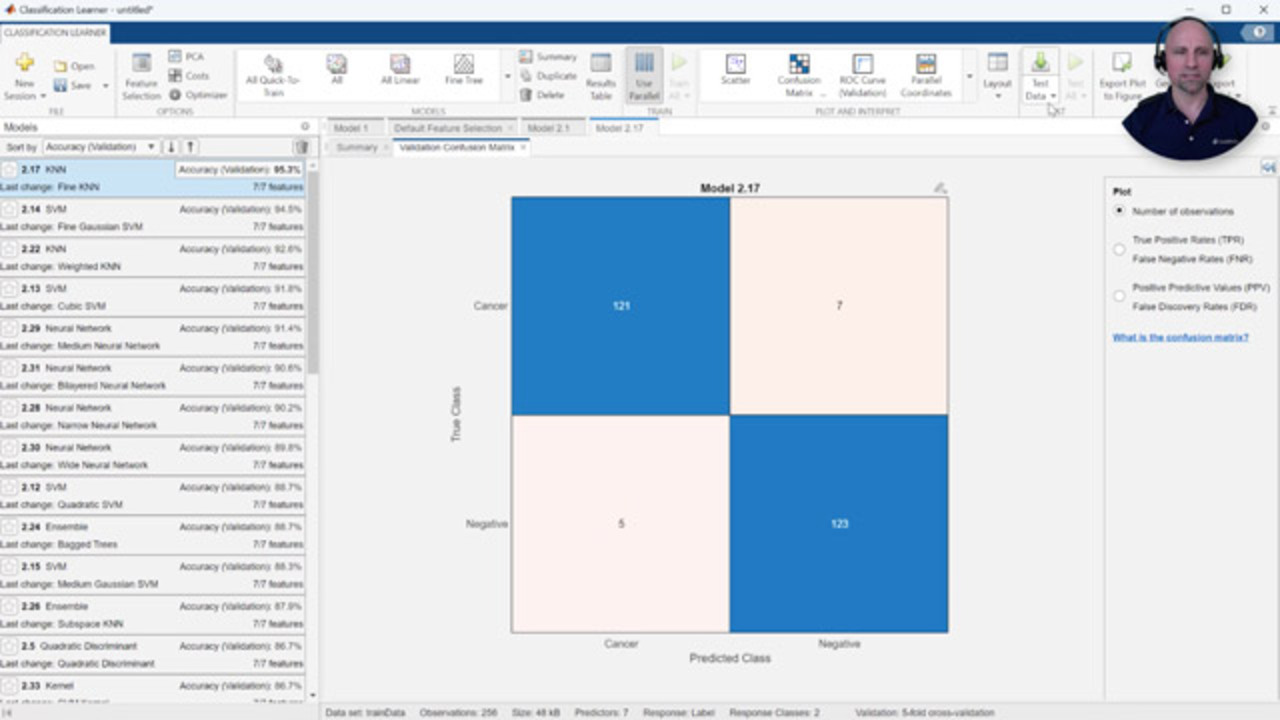
As you see here, since my laptop has multiple cores, I'm able to speed up the training process by training multiple models at a time in parallel. Sorting the results by the validation accuracy, we see we have several models performing at over 90% accuracy. The confusion matrix can help us understand where the model is confusing classes. For example, in this case, it predicted seven false negatives out of 128 true cancer responses and five false positives out of 128 true negative responses.
However, since the cross-validation accuracy is computed using data from the training set, to ensure that this performance is generalizable, we want to test our model with data that was not used at all during the training or validation process. Once we've selected a model, we can then export it for use in MATLAB or in preparation for deployment. We can then use the model's prediction function to make it assess predictions outside of the Classification Learner App.
The prediction function can also return the associated classification scores. Since we gathered intensity time histories from a grid of regions across the entire video frame, we can use these classification scores to create a prediction probability heatmap and compare it against the known lesion biopsy results. More research and data are needed to ensure an accurate and robust solution, but these initial results are very promising.
If you'd like to learn more about machine learning and feature engineering, please check out our free Machine Learning Onramp at matlabacademy.mathworks.com. This free, interactive tutorial will teach you the basics of practical machine learning for classification problems in MATLAB in about two hours. Thanks for watching.

Featured Product
Statistics and Machine Learning Toolbox
Up Next:

Related Videos:


Select a Web Site
Choose a web site to get translated content where available and see local events and offers. Based on your location, we recommend that you select: United States.
You can also select a web site from the following list
Americas
- América Latina (Español)
- Canada (English)
- United States (English)
Europe
- Belgium (English)
- Denmark (English)
- Deutschland (Deutsch)
- España (Español)
- Finland (English)
- France (Français)
- Ireland (English)
- Italia (Italiano)
- Luxembourg (English)
- Netherlands (English)
- Norway (English)
- Österreich (Deutsch)
- Portugal (English)
- Sweden (English)
- Switzerland
- United Kingdom (English)