Find C/C++ Bugs as You Code – Integrate Polyspace into Your IDE
Maximize your C/C++ code quality, safety, and security with Polyspace as You Code plugin. Integrate this tool into your IDE, such as Visual Studio, Visual Studio Code, or Eclipse, to detect bugs early in the development process. Verify code quality before committing changes to your source code repository and receive instant feedback on vulnerabilities. Adhere to industry standards such as MISRA and CERT C/C++ with ease. Experience faster software delivery and higher code quality by integrating Polyspace® code verification tools into your development environment.
Published: 21 May 2023
So I'm going to change the pace a little bit here and talk about a tool that we offer that is actually not for model-based, but I'm sure in your organizations, you probably have people that write hand code. And so we've been trying to philosophically shift left to start verification as quickly as possible, as early as possible, and this is basically one of the things that we're offering to facilitate that.
So just by way of introduction, I am a Polyspace application engineer based here in Novi. Been with MathWorks now for almost 16 years. And six of those, I've been doing Polyspace. The first 10 I was in the Consulting Group did a little bit of everything.
So Polyspace's philosophy is to be a comprehensive static analysis tool to increase your efficiency. And so the way we are going about that, we've always had our traditional code approver tools that some of you may have heard about.
We had the Bug Finder Tool introduced approximately 10 years ago that basically does traditional static analysis where we're pattern-searching for things that are probable errors versus formal mathematical proving, s and that got our performance down to the point where you could run it on a daily basis.
Problem is, people would wait. So you'd write some code, you'd write some more code. Maybe on Friday you try to run the Bug Finder, and it might find something that you wrote on Monday. So you want to basically get to the error as soon as you possibly can, it's much easier to fix.
So we've got that. We've got automation with CI workflows. So there's Jenkins Plugin for Polyspace, GitHub Actions, that sort of thing. And we also have a web server where you can now upload the results and collaborate.
So instead of looking at file-based results like we traditionally had, we have the collaboration capability where you can look at the same thing in the database over a web browser, and, in fact, if you're not running the tool itself, and if you're only looking at results, you don't need to install anything.
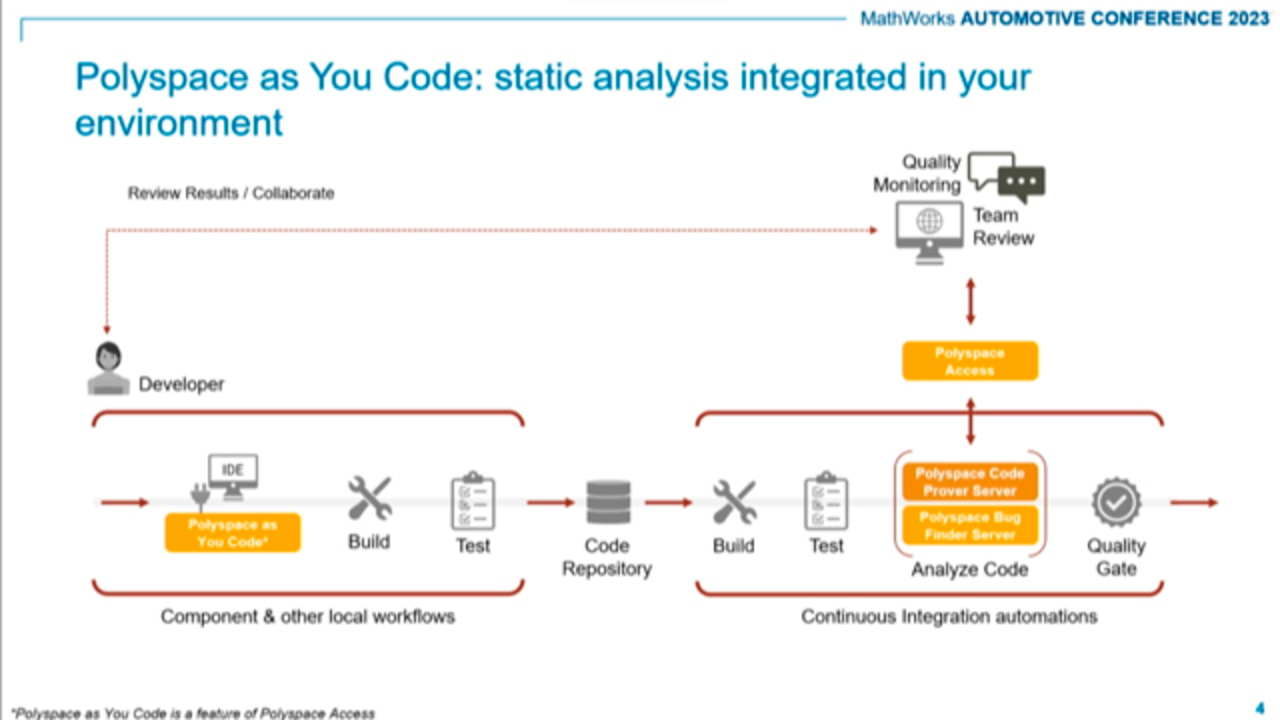
But basically, you want to do static analysis at critical points in your workflow where it will benefit you. And we laid this out as a representative workflow. So it varies from company to company, but usually, it looks something like this. Where do you-- what do you want? You want repeatability, you want faster delivery, you want higher quality. So one of the strategies can be to do static analysis.
So at integration test time, that's a good application for Bug Finder. It will find things that were unit-tested components, you put them together and maybe the interface wasn't quite right. You can run static analysis at unit test time and that will find problems in the individual units. And now, you can write it when you're-- you can run it when you're writing the code.
So we have the IDE plugin that will essentially give you results as you write. So we have a success story on this. Volvo adapted all of this. And the thing I want to point out here is the yellow highlight there. So they are actually running static analysis prior to submitting their code. OK.
So this is the overall architecture of Polyspace. You have-- actually, let me get my-- yeah. So as a developer, you're going to be writing code. You're going to probably be using an IDE if you're doing hand code. You're going to build within the IDE. You're going to do some kind of keyboard-level testing, make sure that it more or less functions. You're going to submit it to the code repository.
It's going to build possibly overnight, possibly on demand. You're going to maybe run some automated tests, but you can run the formal verification, Polyspace Bug Finder, Code Prover, upload that to the web server, and then inspect it from there. So it's basically covering all the bases.
We'll look at the Polyspace as you code part. That's the topic of today. So that's the IDE plugin. I'm going to show it in VS Code, but there are other supported IDEs. So this is basically your first opportunity to fix problems.
So some of these may resonate if you've written hand code. You can do it on-demand. You can also do it on save. But it's before you commit anything, before you've actually keyboard-tested it while you still remember what it was were trying to do. And it's basically the easiest and least expensive place to fix problems.
The other thing that we found it does it it helps develop good habits. So if you consistently write something that's flagging a MISRA error, you eventually get used to not flagging the MISRA error. So if it's telling you in the IDE, you're going to stop doing it sooner.
Now we support both VS Code, but we also have Eclipse and Visual Studio. So that covers most of it. There is a command line for it, and so it can be integrated into things like eMACS. So what does it actually do for you? So we enforce coding standards and we find defects.
So this is the same functionality that we have in our Bug Finder product. It is limited to single-translation units so it isn't the full Bug Finder which considers source code in multiple files. This is single-file. The idea was to be fast.
So we will find all of the defects that are possible that are decideable with one file, and we will check the subset of coding standards that are single-file-checkable. And we do apply all of the supported coding standards we have. We also check your software metrics and provide guideline checks.
So here, you can establish threshold values that you don't want to exceed, and we will check it and flag it as a defect for you. So if you're writing something that's just got far too much nesting, it will flag that and you can have an opportunity to re-implement it in a different fashion right before you check it in.
All of these things, I say as a developer, would help me to avoid embarrassment. Because I'm going to go to a code review with my peers, I don't have to show them anything that contains these defects. I can catch this right in the IDE, nobody's going to see it but me.
As far as configuration, you can centralize the configuration of this tool across your teams. So most of the configuration information is in a single XML file, and you can define all of the checks that you want everyone to comply with and then configure the tool on their desktop to only check those. You can import it from our desktop product as well so you don't have to reinvent anything.
And if anybody in the audience has used Polyspace, this window will look somewhat familiar. It's basically a subset of the setup we have for Bug Finder. OK.
So, what does it do for you? OK, so this screenshot is VS Code. We have comparable configuration in the other environments. So anything that's Eclipse-based, which is a lot of compilers have an Eclipse-based IDE, but VS Code seems to be slightly more popular than the others, so that's what the screenshots are.
So essentially, what do you do? You monitor your source code. So the source code that gets verified gets listed up there in the upper-left corner. You get the same trace information that the Bug Finder Tool provides. So our Bug Finder gives you an event trace, which is a static trace back like similar to a debugger. We do the same thing here. The only difference is here it's a little bit more limited because it is single file.
So if you want to see details about the code or auto-justify, we have that capability. So you can insert the specially-formatted comments and you can link back to the documentation. All of that is based-- is embedded right in the IDE plugin. And again, we have the other IDEs as well.
So the local analysis is run on demand any time you want, and it's also on save. So you can imagine on save, you wouldn't want to have a noticeable delay in saving your file. So we focused very hard on performance for this so that the save is not a noticeable delay between trying to save it and having the actual file be saved.
You can also add a file to that monitoring panel. So if we go back just one, the monitoring panel up in the upper-left there, that's basically going to let you look at what your results are and you can run it from there as well. And with VS Code, it's either less than less than 9 or 9-plus. That's just room for four to characters there.
We've also added just recently an auto-fix. So this is the biggest jump for productivity. Instead of justifying something with a specially-formatted code comment or going back and hand-typing, we also provide some suggested fix. And you can either choose our suggested fix or not, but if you do, it we'll just edit the code for you.
So in this case, we have a useless INCLUDE check, which basically-- that can happen quite a bit. Especially with hand code, you've got this set of five or six INCLUDEs that you tend to put in just about everything, so you just start putting those five or six in everything and maybe you don't need them all.
It does slow down the build and some build systems when you do that. So you can get rid of them. You can just auto-fix it right here. We do allow you to comment it out, so if you don't have confidence, you can get back.
So I do have demo capability for this. So if you want to come by the booth, I can show the Polyspace as You Code in VS Code. And you can also download it directly. So Polyspace as You Code is not actually a MathWorks product, per se. It's a feature of Polyspace access.
And poly Polyspace Access is two related products. One is Polyspace as You Code. The other is a web server to use for uploading results and collaborating. And so the traditional way to get Polyspace as You Code is to download it from your running web server, but we have found that a lot of people also want to try Polyspace as You Code either first, or maybe they don't want to use the web server at all.
So we do have direct download links, and these basically stay consistent across releases, we just changed the folder. But it uses the Polyspace Bug Finder Access license, which is on a per-user basis.
We also have training coming up for Polyspace. So if anybody is new to Polyspace and your company has it and you want to learn more about it, we do have a training course coming up. It's a public training on May 2 and 3, and then again in June. So I would encourage anyone to look at that.
Polyspace as You Code will be covered along with all of the other stuff in the Polyspace Tool suite. So it's a good opportunity to get familiar with Polyspace. And that's really all I had for slides. To demo, I do encourage you to go by the table. It's lonely over there.
Related Products
Learn More
Featured Product
Polyspace Bug Finder


Select a Web Site
Choose a web site to get translated content where available and see local events and offers. Based on your location, we recommend that you select: United States.
You can also select a web site from the following list
Americas
- América Latina (Español)
- Canada (English)
- United States (English)
Europe
- Belgium (English)
- Denmark (English)
- Deutschland (Deutsch)
- España (Español)
- Finland (English)
- France (Français)
- Ireland (English)
- Italia (Italiano)
- Luxembourg (English)
- Netherlands (English)
- Norway (English)
- Österreich (Deutsch)
- Portugal (English)
- Sweden (English)
- Switzerland
- United Kingdom (English)