Basics of Point-Cloud Processing | Making Vehicles and Robots See: Getting Started with Perception for Students
From the series: Making Vehicles and Robots See: Getting Started with Perception for Students
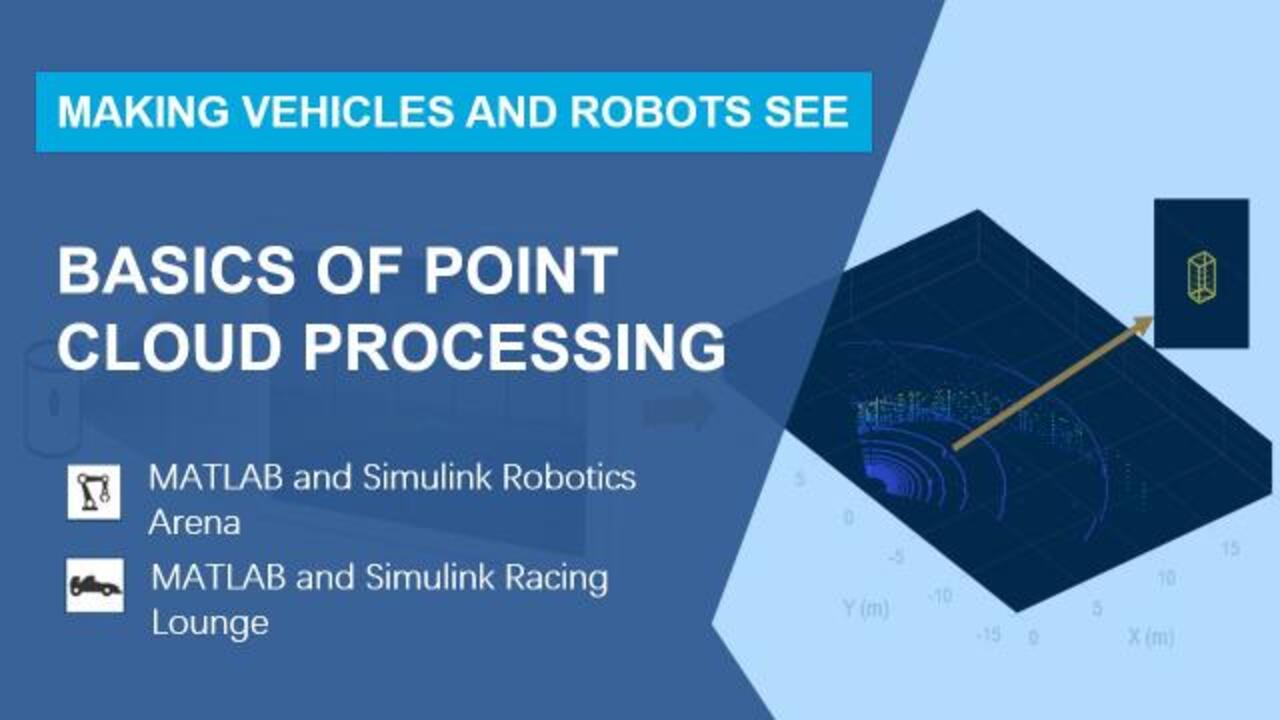
Learn the basics of point-cloud processing, including preprocessing and segmentation. Start with exploring what a point cloud is and the general workflow for estimating the location of objects in three-dimensional space using point clouds. First, discover how to preprocess a point cloud using techniques such as denoising, downsampling, and finding points in a region of interest. Next, see how to remove the ground plane and segment points of objects into clusters. Finally, learn how to estimate the locations of objects based on the features of clustered points. At the end, please follow an exercise on using a similar workflow to estimate the locations of poles in a point cloud captured by an aerial vehicle.
Published: 14 Jul 2022
When designing autonomous system, you can use point clouds for perception, since one point cloud usually carries more spatial information than the image. Today, you will learn how to estimate the location of objects in a three-dimensional space using point cloud segmentation.
First, you will explore what a point cloud is, and then discover how to preprocess a point cloud using techniques like denoising and downsampling. You will see how to remove the ground plane and the segment objects into clusters. And finally, how to estimate the locations of objects based on the features of cluster points.
To begin with, let us understand what a point cloud is. A point cloud is a set of data point in a 3D space. Each point is represented by xyz-coordinates, and may also include additional information such as intensity or RGB values.
You can get access to a point cloud in various ways-- possibly, a prerecorded PLY or PCB file from a robot, a Velodyne sensor streaming the data live, or just having the data stored in a file.
Here, you can use the data loaded from a MAT file. The data was generated by simulating a Simulink model with the Unreal Engine, where a LiDAR sensor was assumed to be mounted in the front bumper of a racing car. Please refer to the video series on using Unreal Engine with Simulink for detailed information.
After loading the data, you'll notice there are 40 matrix called pcLocations. It presents multiple frames of points, organized according to the spatial relationship of the LiDAR beams used for capturing the points.
Instead of organized one, some LiDAR sensor may organize the point cloud, where points are arranged arbitrarily in a single stream. The two formats can be converted to each other. And which one to use depends on the subsequent processing steps.
Now let us see how the data looks. You first create a PC player and view the point locations frame by frame. Then your task becomes how to estimate the locations of objects-- for instance, cones in each frame.
The general workflow includes data preparation, preprocessing, segmentation, and postprocessing. For more convenient handling of the data, you can use the 3D coordinates or points in a frame to create a point cloud object. Then, you use pcDenoise to reduce the amount of noise, pcDownsample to reduce the size of data for faster computation, and found points in ROI, together with select, to remove the points that are out of a region of interest.
In our example of detecting cones, the ROI could be defined as a cubic region with reasonable height. So any points too high or too low will not be considered.
After those preprocessing steps, you can see part of the points representing the ground plane, the fence, and the cones remain in output. To remove the ground plane, different methods available respectively for organized and unorganized point clouds. You can try pcFitPlane to find the index of long ground plane points, and then you select to keep these points.
But here you see in the output, the points representing cones have been removed as well. To avoid this, you need to evaluate different preprocessing methods and use one that can keep most points of the object of interest. If there are also points of other objects left, like the fence in this scenario, the next step will be clustering the points to separate different objects. You can try pcSegDist to segment points into clusters based on Euclidean distance.
After displaying clusters with different colors, you see that the fence and the cones are segmented as expected. For postprocessing, you calculate the features such as the maximum height, width, and length of each cluster, and check if the cluster represents the object of interest according to its features.
In this case, we are checking the size of the object to see if it matches the expected size of a cones. If a cluster pass the check, you create a bounding box around it, otherwise remove the cluster.
The location of the object in a 3D space and its distance to the LiDAR sensor can be estimated. Results show that in most frames, cones can be located correctly.
Before we close, we have prepared some more exercises for you. Considering a point cloud frame captured by an aerial vehicle, please follow the workflow to detect how many poles are in the scenario, and the location of the nearest one in the xy-plane. Attempt to complete the missing code in the template, and then verify your results with the LiDAR view app, which provides the interactive tool for visualizing analyzing, and preprocessing different LiDAR data.
To sum up, a point cloud carries more spatial information than an image. Methods and their parameters in the basic workflow for estimating the locations of objects in a 3D point cloud need to be tuned for different scenarios. More advanced techniques, such as DBSCAN, the unsupervised learning method, may also work here.
Besides this, both point cloud SLAM and deep learning are worth further study since they are also widely used. If you have any questions about the video or the exercise, reach out to us at roboticsarena@mathworks.com. Thank you again for watching this video, and see you in the next one.


Select a Web Site
Choose a web site to get translated content where available and see local events and offers. Based on your location, we recommend that you select: United States.
You can also select a web site from the following list
Americas
- América Latina (Español)
- Canada (English)
- United States (English)
Europe
- Belgium (English)
- Denmark (English)
- Deutschland (Deutsch)
- España (Español)
- Finland (English)
- France (Français)
- Ireland (English)
- Italia (Italiano)
- Luxembourg (English)
- Netherlands (English)
- Norway (English)
- Österreich (Deutsch)
- Portugal (English)
- Sweden (English)
- Switzerland
- United Kingdom (English)