Modeling the Impact of Climate Risks on Mortgages
Discover how you can quickly get started modeling both physical and transition climate risks using MATLAB®. You will learn how to:
- Visualize flooding risk within a city (physical risk)
- Understand the impact of policies aimed at increasing the energy efficiency of buildings (transition risk)
- Model their impact on a portfolio of mortgages
Published: 14 Oct 2021
Hello. Welcome to this presentation on modeling impact of transition and physical climate risks on a portfolio of mortgages. I'm Lawrence, an application engineer at MathWorks.
If you have bought an electrical appliance in the last decade, it is highly likely that you've come across the energy rating certificate. The idea is that it tells you how much energy the device consumes annually.
You could have a similar metric for buildings. The UK government plans to transition as many homes as possible to energy band C or better by 2035. To achieve this, the UK government is subsidizing the installation of more efficient heat pumps.
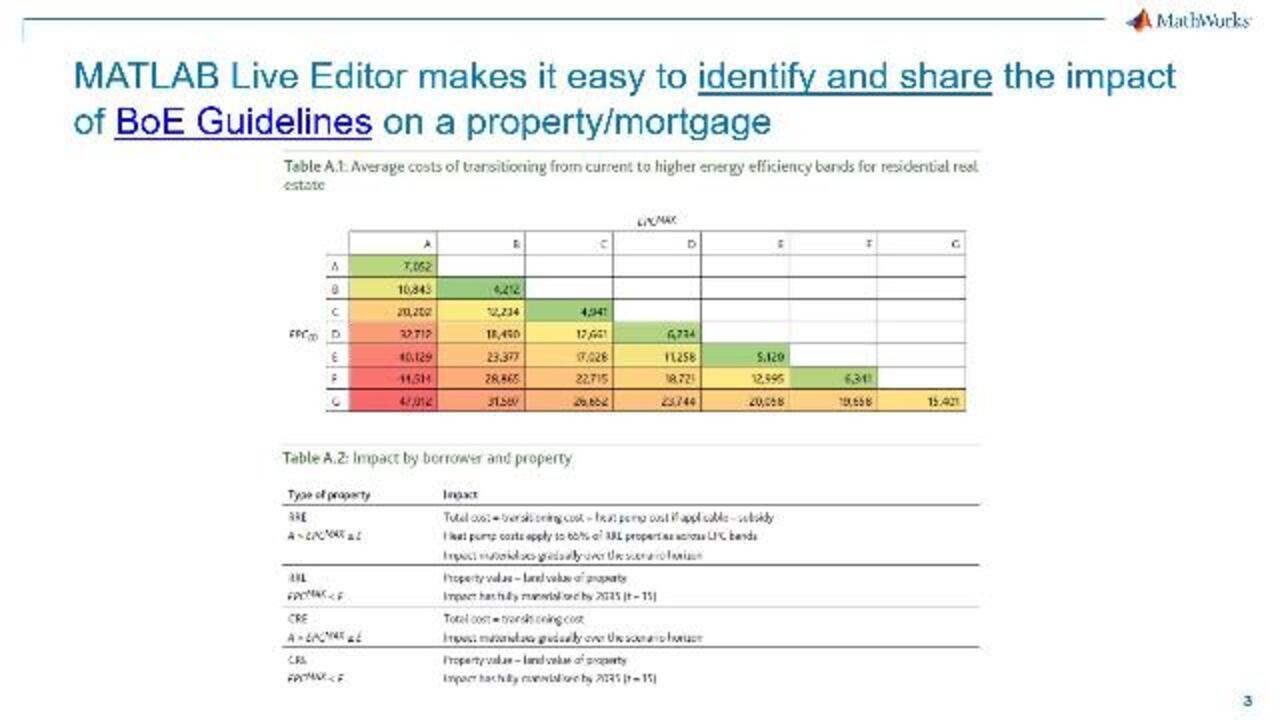
Moving a property from an energy rating of, let's say, F, to another energy rating of, let's say, B, incurs cost as outlined in the climate biennial exploratory scenario laid out by the Bank of England. The costs include improving insulation and upgrading heating. There are also subsidies the homeowners could take advantage of. While calculating transition cost, the land cost also needs to be taken into account.
Using live controls in MATLAB's Live Editor, it is very easy to get an estimate of transition costs and share the same with others. Let's switch over to MATLAB and have a look. I've defined the current value of my property, the current land value, the type of property, and whether the property requires a heat pump. I've also got the current EPC rating, let's say it's an F, and the EPC rating to which I'm transitioning to.
Here you can see that the total transition cost has been calculated to be 16,500 pounds. I can share this with someone else by simply sharing this live script. Or if I want to make it static, I can save this as a PDF file or a Word document and send it to someone.
Now that we have seen a shareable live script. Let's have a look at how we can visualize a large number of properties together on a map. For doing this, we have set up an app built using App Designer in MATLAB. I am bringing in the properties that I'm going to plot on the map. So here I can see the properties that I have in my list, all plotted on the map. For quickly visualizing the energy rating of these properties, I can toggle this control to ON.
And as a reminder, I'm interested in properties that have good energy ratings. So that's between A, B, and C. So that's if I want to have a look at how many properties have a rating of B. I can quickly understand that by filtering this map by properties with energy ratings of B.
Here's our agenda for this presentation. We will start by having a look at how to visualize the scale of the problem. We already saw have to have a look at energy ratings of the neighborhood. The Bank of England also require that financial institutions understand how these areas are affected by physical risks, such as flooding. Then, we will look at the impact of policies aimed at increasing energy efficiency of buildings. Finally, we will see the impact of these risks on a portfolio of mortgages.
Climate risks are of two types, physical risk and transition risk. Physical risk can be further split into two, acute risks, such as flooding risk, or chronic risks, such as sea level rise. Transition risks are the financial risks associated with transition to climate friendly options. In our case, we are looking at getting buildings to have energy ratings of C or better. In order to get buildings to have better energy ratings, the Bank of England has defined two different scenarios, early action if the action is taken before 2031, late action if the action is taken after 2031.
Based on when the transition efforts are taken into account. There are some subsidies that could be had. What do these risks mean for financial institutions? If you're an insurer, you need to be able to quantify the risk due to flooding for the properties insured. If you're a bank, you need to estimate the probability of default for properties that you have long term.
Before we go further, just a small note on data. We are looking at the energy ratings and flooding risk of various properties. The data for these two data sets come from these two websites, respectively. For the energy rating, we obtained the data via the API. For the flooding risk, we are saving the data in one of the mapping formats, such as KMZ.
Prior to getting into modeling using the data, let's address some challenges. While performing climate modeling, we are often working with big data and diverse data sets. Regional demand requires some involved coding. Once we have read them in, we need to build a model and distill down just the insights using customized dashboards. And from there, we need to integrate these insights into analysis and identify the impact on markets.
Now let's move over to the app. As we saw in the beginning, we could visualize the EPC rating and flood risk within this map. So we saw the EPC rating. And if I were to switch over and visualize the flood risk of each of these residences. I could toggle the switch and visualize the flood risk. And similar to what we did in the EPC rating, we could just filter the high risk areas.
For adding further depth and details to this map, I could also have a look at web maps, which are part of MATLAB mapping toolbox. Let's have a look at MATLAB web maps. With a few clicks, I could be looking at the topographic map or the shaded relief map, while keeping my data plotted within the map.
So here, I've got my data plotted on this map. And if I want to quickly swap out the underlying map with something else, let's say, I want to choose the topographic map. We do that over here, set it up, and then understand my data, with respect to this map.
Now that we have seen how to bring in data and visualize it. Let's have a look at how to model a mortgage and understand the impact of climate risks. We look at how the transition costs impact the expected credit losses. You'll probably get default, and the risk, weighted assets. Let's switch over to-- well, that's correct. What we do with this modeling.
So we start by projecting the mortgage loan to value ratio based on the Bank of England guidelines. And from that, we estimate the provisions. So we start by defining the characteristics of the property. Here is the current value of the property, the current energy rating of the property, the maximum energy rating that we plan to transition to, the loan balance, land value, do I require a heat pump, and under what scenario taking action.
So based on these definitions, let's calculate the projections. And so here I've got the table. Where I can see the how the loan evolves over time. Here's the loan balance. Here's the adjusted value. And here's the loan to value ratio.
The orange dotted line shows me how the loan to value ratio decreases over time. The blue line shows me how the adjusted loan to value ratio changes over time. Adjustment refers to the transition costs calculation that is being taken into account here.
Changing the scenario gives me an idea of when the impact kicks in. In the case of late action, we see that 2031 is the cut off year. And you see a slight bump at the year 2031.
Now, let's look at provisions. We'll start by calculating the expected credit losses. I'm using one of the functions of a risk management tool box. It's called predictLifetime. I flipped to the documentation page of predictLifetime.
MATLAB has a rich documentation for all of its function. There is an example, and have to use this function. With this function, you also get to play around with this function in the online environment called MATLAB Online. With the click of a button, you're taken to an online environment where you can quickly try to function with the water example.
So here, I've calculated the expected credit losses. Further down, I've completed the probability of default using the ASRF model, as outlined in Basel II guidelines. I've also computed the risk weighted assets.
So here's a summary of what we saw. We saw a few challenges of climate risk modeling, employment modeling, getting data, and pre-processing data. It's a time consuming process. Once the data is read, insights need to be boiled down to just the essentials via custom built dashboards.
MATLAB comes with a battery of functions to read and a wide variety of data types and from a wide variety of data sources. Dashboard creation is easy and straightforward using MATLAB App designer. MATLAB functions are robust, well tested, and packed with rich documentation.
That brings us to the end of the presentation. I'm happy to take your questions. Thank you.
Featured Product
MATLAB
Up Next:


Related Videos:


Select a Web Site
Choose a web site to get translated content where available and see local events and offers. Based on your location, we recommend that you select: United States.
You can also select a web site from the following list
Americas
- América Latina (Español)
- Canada (English)
- United States (English)
Europe
- Belgium (English)
- Denmark (English)
- Deutschland (Deutsch)
- España (Español)
- Finland (English)
- France (Français)
- Ireland (English)
- Italia (Italiano)
- Luxembourg (English)
- Netherlands (English)
- Norway (English)
- Österreich (Deutsch)
- Portugal (English)
- Sweden (English)
- Switzerland
- United Kingdom (English)