Modeling the Impact of Climate Risks on Mortgages
Regulators, customers, investors, and other stakeholders are driving financial institutions to do their part to transition to a low-carbon economy and manage exposure to climate-related risks. Central banks are conducting climate stress test exercises. They are using new data sources and developing new types of models, often leveraging methods from other scientific and engineering fields. Practitioners need software that provides a broad range of modeling functionality, flexible interfaces, rich visualization capabilities, collaboration, and review features to keep up with the pace of change in this area.
Learn how you can use MATLAB® to model both physical and transition climate risks. In a live demonstration, you will learn how to:
- Visualize flooding and subsidence risk within a city (physical risk)
- Understand the impact of remediation costs or policies aimed at increasing the energy efficiency of buildings (transition risk)
- Model the impact of these on the credit risk exposure in a portfolio of mortgages
Published: 18 Nov 2022
I already saw climate is one of the hot topics in finance. And this talk is going to be a bit similar to what Martin just showed. It's going to be about looking at climate risk. And this time, we're going to go a bit more into the details. And at MathWorks, we build a use case around the impact of climate risk on mortgages.
Why? Well, it's because speaking with our customers, speaking with other people, we found out that everyone are starting to look in these topics, to look at those models and this data. And there is a lot of challenge that still need to be resolved, but what we also saw is MATLAB is one of the key player around those that are here to help them to overcome all of those challenges.
So my name is Yannis Ben Ouaghrem. I am an application engineer at MathWorks, specializes in climate finance. And today, I will show you how to overcome those main challenges that might occur when you try to capture, model, and visualize climate risk. And here today is going to be applied to a mortgage portfolio, but the idea is to show you a workflow and not just a use case.
So let's get started. So we're going to speak about climate risk. And as also we mentioned this earlier this morning, there is different categories of climate risk. The first one that is I would say the most well known and easy to identify one, it name the physical risk. It's all risk that are caused by natural events. So here, we have, for example, a heat wave, wildfire, flood. So everything that is caused by a natural event is considered as a physical risk and it's much more easier to understand and visualize it.
But that's not the only one that we're talking about today. We can also look at--
[AUDIO OUT]
So the one that we're going to focus today, and the example and then going to show you is climate policy. So government institutions changing the rules, changing the laws, to make sure that they can get to their climate goal.
So combining those two types of risk, we speak here about risk exposure. And there is a lot in here that we can list. So here like three main things we can upsell, like economic losses, trying to buy assets, or integrate valuation for example. And in the example, in our use case today, we're going to look at one specific value. We're going to look at the ratio between the loan and the value of an asset, and this will help us to get a lot more financial indicators around it.
But again, it's up to the use case. It's up to the workflow. You can look at a lot of things using those two risk. And what we try to answer is how exposed to climate change is our mortgage portfolio. And when I mean about that is we want to understand if tomorrow, some climate data will change, what this will mean in term for my mortgage portfolio. Will I get more probability of default for some of my borrowers? Or shall I approve this new mortgage or no? So a lot of consequences can be applied.
And in here, we're going to first focus on the three main challenges that we identify. So the first one, and one that most of our customers are struggling with, is how to capture and centralize valuable data. Because there is a lot out there. We can find a lot of different data for different granularities, and it's not straightforward sometimes to really understand it and get some useful insight out of it.
So then, when this challenge is resolved and you get some valuable data, there is a question of how to process it. How to extract valuable insights and produce efficient models, of efficient production, how to understand what is going to be the future like in different types of in different what-if scenarios. So all of this is also something that is not straightforward to do, but it's possible.
And the last one, when you have your model, you have your data, you want to find a nice way to show it, to let the end user use your work. And they already have the answer that they were looking for and they already have this exposure to climate risk on the mortgage portfolio.
So what does that means for us is we built an app that highlight the third challenge. So to show the real to an end user called the Climate Risk Mortgage Portfolio Manager app, and it allows you to load a mortgage portfolio on here and actually have all the data in front of your eyes. Some scenarios, and let you in an interactive manner, switch from one to another. So without further ado, I'm going to show you quickly the app itself.
So it's a MATLAB app. And the first thing I'm going to need to do right here is to select a region because each region has their own data sources.
Yannis?
Yeah?
I'm not sure that sharing the right screen here. It's got-- a box with a couple buttons on the bottom.
Right.
Now it looks like I can see your desktop, maybe.
Yeah, no I am trying to move away, the app at the right place.
So I see MATLAB.
And now can you see the app?
It's still got this-- it looks like the app is in the background, but it's got a box that wants to be clicked.
OK, that's fine.
OK
So can you see the box? Sorry can you see it-- but can you see what's in the box, or no?
Yeah, I guess so. I think.
OK, all right. I'm going to just talk about--
Yes, I can see. It's very small, but I can see it, yep.
OK. All right, so first step is to select the region. So by selecting the region, you choose a--
[AUDIO OUT]
So we're going to first load a couple of scenarios. It's going to be displayed right here. So in here, the good thing for France, we have two types of climate data that we can look at. So the first one is flood risk. So we were able to manage to get some flood risk data for the entire French country. So that's good.
And the second one is energy efficiency risk. It's a little letter that every building have that tells you how good or bad your building is in terms of energy consumption. And what is the transition scenario, is because we saw that mostly in Europe government like this kind of metrics and like to create laws around those this metrics. So that's why it's a transition table. It don't go away. We're going to go into details about those two types of risk afterward.
So the first step of the workflow is to select your portfolio. So let me just open very quickly the Excel to show you a bit what type of data that we are using it. It's fairly straightforward. So we have a bunch of residents right here, having an ID, a type, an address, and a post code. So nothing more.
And when we import this type of data, this is getting brought up right here. You're going to appear right here. So what are we going to do-- why? There you go. Load it at once. So we have all the assets that have been loaded up, and when we select those, we're going to get them displayed in two different places.
One is this table at the top. And the other one we're going to have a map right here that allows us to have a better understanding of where those properties are. So the good thing is, as you can see, we only have an address and a post code. And all the rest all, so all these databases you see right here are coming from external data sources. So we actually are not using any physical data. And that's the good thing of it because you can come and plug your own data sources to get different data.
And if I want to go a bit more into the details, I can click on those cells and get more information around the data that we have. So for example, if I'm looking at this medium risk in terms of flooding, I can see all the data that has been used to decide that this property have a major flooding risk. Right.
So now, what do we do? So right here, we can select to work with different type of risk. So here if I'm selecting the flooding risk, I'm going to load the projection that is on the scenario that is selected. And when this is done, we're going to get some-- cholera is appearing in India, which is quite nice because it's going to give you a better understanding on where those medium flooding risks are located.
So I'm going to try to zoom a bit slow, but what I want to highlight right here is for the-- so for those properties that have a medium flooding, risk they are all close to a river or a sea entry, which means that logically, there is more risk, flooding risk associated to them. So it's good to see that the data is kind of highlighting what we suppose.
So now I'm going to switch to another. So it's another scenario right here. So we're going to look a bit more about those later, those EPC, so energy performance certificate later. And this time, I'm going to play a bit with all the scenarios that I have available right here. So those scenarios are some what-if scenarios. And I'm going to show you later in this presentation how did we construct those.
So for example, we have here now the EPC scenarios. So if I go a bit further into the future, you can see some of those letters getting changes. And why that is because all scenario right here have some rules that will change the asset value and the loan balance, giving you some new LTV value as a bit different.
So for example, let's say that I'm moving far away into the-- so the future, right here, some of mine most of my loan have been completed, which is something also that we would expect, but some of them are not. So I'm just going to switch from one model to another. And I'm not sure if it's big enough, but the LTV right here will not be the same.
This specific here so, that's mean, that with this kind of tool, or this kind of interactivity, you can quickly go into your mortgage portfolio. Very different scenarios and directly see this LTV value changing across the year without having to manually go and calculate it over and over. Which is quite powerful because behind all of this, there is a full framework that is very flexible and lets you look at many different financial indicators with different types of climate risk.
All right, so I'm going to go back to my slide right here. So now, now that I show you a bit what we show to our customer and what if we play with, let me introduce you a bit more details around how did we get there. And the first thing that we work with our customers was about accessing climate risk data. So every type of data that could help us to understand if that's related to specific region or specific property.
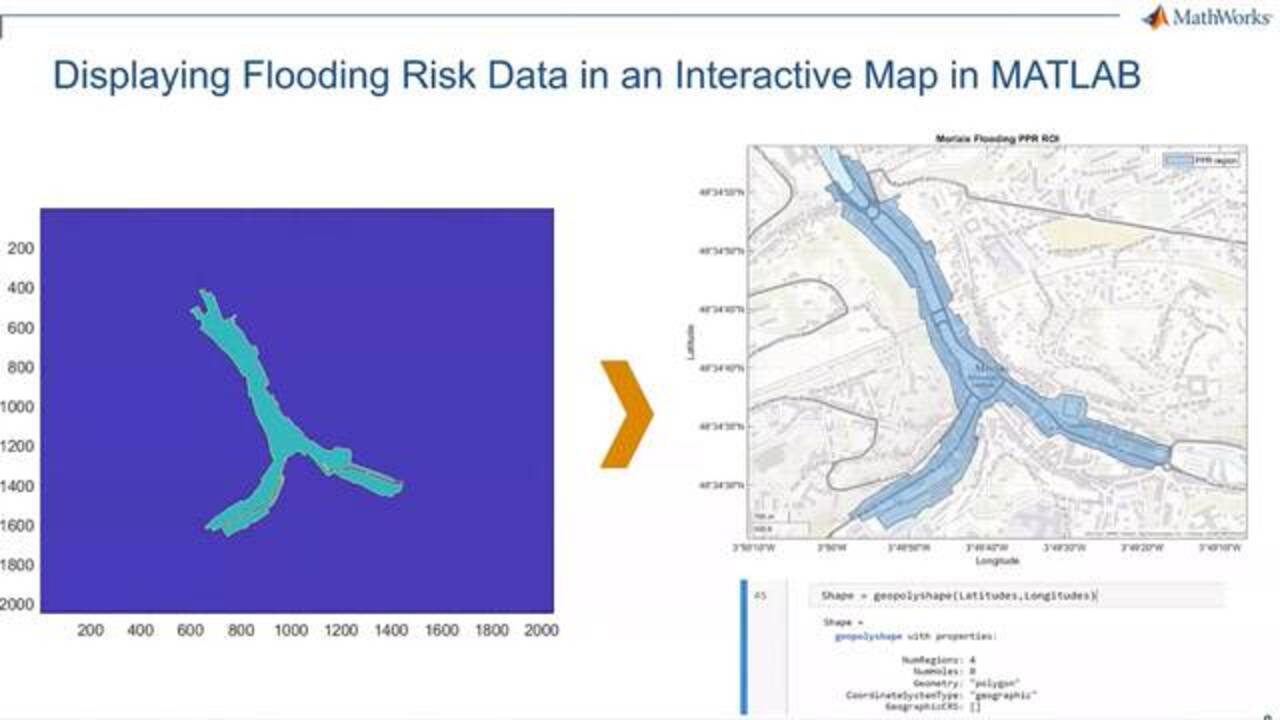
And the one that causes a bit more work, a bit more, I'd say processing and cleaning, is all the data related to physical risk. And why that is because we mainly use maps around that. So for this example, for the French country, we use some flooding risk data. And what is behind this, so that is one very specific example, we have something called Web Map Services, which is a map posted on the web. And you can retrieve it with some HTTP requests, for example.
And what this map tells us-- well, we're going to look at something which is specific to France, but I'm pretty sure that any country in Europe have their own way of expressing flooding risk. It's called a plan de prevention.
[AUDIO OUT]
That tells us that this PPR is applied to this specific region. So for now, with only this data, is not-- there is some work to do to really understand what it is don't need to be projected. But first we need to get it in MATLAB. And to do so, it's very straightforward because our mapping capabilities already have some function that allows you to play with web map services, which simplify a lot the workflow.
And that will give you an image in MATLAB. So when I say animate, it's a pixel by pixel, and you're going to know exactly where. So in this zone, what is zone, so where this PPR region is. So now that's nice. We have an image. But we need to change it to make-- we need to format it in a way that we can plot it on a map. And to do this, again, with some mapping.
[AUDIO OUT]
Geo mapping called this kind of shape a geopolygon. And this geopolygon can then be plot in any interactive map like this one for example. And this giving this is giving us a very precise understanding of where this plan has been applied. So with this type of data, then, if we select one very specific property, that we know based on our mortgage portfolio, we're going to get a lot of data from it. We're going to know exactly which layers are applied to this property and what is in beneath those layers.
And with this, with some text analytics or other techniques, you can easily take this text data, format it, clean it, and classify it to a rating. And that's how we get our rating in the app is we're going to take one very specific point in the--
[AUDIO OUT]
--rating that can help you then to get to do to build further application. So just to summarize a bit the good thing is with MATLAB we can connect to many different external data sources, like databases, data feed, REST API, cloud data, big data cluster, even maps, geomaps, or even connecting well using raw images, which is quite nice to just centralize many different data sources altogether and consolidate your own data set.
So when we have the data now, there is a question of how to create scenarios. So how do we understand this data, project this data for the future, and understand it and translate it, this change in this data into financial indicators? So we're going to focus here on these EPC ratings. So this letter that every building, many every building now in Europe have, telling you that--
[AUDIO OUT]
--through the app. France already have some laws in place, forcing the owner to upgrade the property to a very specific minimum letter. And they plan to move this minimum letter further up across the year. So you can easily think about, you can now easily visualize that this is a transition risk. Because if you need to make some change to the property, you're going to need to spend more money. And what is money come from? This is up to the owner, but that's considered, that can be considered as a risk.
So how do you predict this climate data? We're going to use the NGFS Climate Scenario Framework. And what does this mean? We're going to use some way of projecting transmission risk, defined by the NGFS entity, which is going to be orderly, disorderly, and wholesale as well. So orderly is a nice transition that's getting, occurs gradually. So for example, 10 years you get a new rules, and we're going to be slowly drifting to our climate goals.
Disorderly it's a bit different. It's going to be like the green curve that you have here. So we're not going to do anything at the start. And at some point, we're going to say, OK now we need to do something to get our climate goals rich. And we're going to have a very harder transition.
And the last one, the hothouse world, is we're not doing anything, and we see what happened. And that's a good way of comparing different techniques. So, now saying this, how does it apply to our use case?
So the first thing we can see this kind of transition about the EPC as a gradually, make an orderly transition every 10 years, we're going to have a new minimum letter. And we can go over the years like this. Orderly is going to be a bit different. We're going to not do anything during the 21st years, and then every five years, we're going to have a change in this minimum letter. And the hothouse world, we're not going to do anything. So it's going to be this minimum letter F across the year.
So obviously, this is using a big assumption. I'm pretty sure we're not going to reach A letter in 2082. All that can-- this is here to highlight the thinking behind it. So if we take a quick example, if we have an ABC rating in 2022, in 2042, we're going to have, if we use the orderly scenario, we're going to have a D minimum letter. If we look at the disorderly scenario, we're going to have E, and the hothouse world, we're going to have F.
If we look, if we did the same exercise in 2062, the orderly scenario is going to be B. Disorderly, A and the hothouse world, it's going to be E. And that's how you can quickly get this climate data projected in the future and understanding the transition behind it.
So now that we make some changes into this data, how do we understand the impact that this change will have on our portfolio? Well, there is a lot of ways of doing it. And there is no, I would say, general techniques and to learn how to do it. However, for example, Bank of England have already thought about that and come with some numbers that tells us the average cost of transitioning from one EPC to another.
So with this type of thinking, then we can map a price to a change. And this will give us this kind of visualization because when you need to make a change, you need money.
[AUDIO OUT]
Yeah, this is showing us a change in the EPC, rating showing that LTV is going to be different. And if you combine this with a model that tells us the probability of default, then you can get a lot of different financial indicators. Until the provision that you would need to get. And if we go a bit more into the details, as you can see, we can see that this LTV change is going to also have an impact over the probability of default right here.
And this means that, for example, if we look at the risk, weighted assets is going to also represent like a bit more provision then going to need to be taken to make sure that the risk is getting tackled, right? So this is a quick example, an illustrative example, to show you how to get this done.
And if we combine this workflow to a multiple scenarios, you can easily think why did we come up with the map at the end. Because if we can gather all of these data and scenario at the same place and allow the end user to use a couple of clicks to get those done, then you get a complete workflow. And that's how we would answer this question on how exposed to climate change is my mortgage portfolio.
So we built this use case to highlight how we could possibly help with this question. It's flexible. You can add your models, your data, your type of mortgage. You can also think about looking at something totally different. And you can also change the region. You can look at the country, at a region depending on the use case. So it's the idea is to have a very flexible environment to allow you to quickly analyze the data that is out there.
OK.
I show you this application, helping us to understand the impact of the mortgage portfolio. But as Maya also mentioned, we built some tools to gather the data, gather the data that is out there. For example, we have a Climate Scenario Explorer that go and get the NGFS scenario data in a month for example, allowing you to do some comparation and many other activities and allow you to export, import this data into MATLAB and work directly with it, which is a very good tool for everyday exploration analysis.
We also work with some partners and implementing some stress technique. This time was for corporate loans portfolios. But those techniques are fully available and implemented in MATLAB and you can directly take those in your workflow, put your data and read through it. That's another type of example that we like we do.
And the last one, it's also something that Maya showed, and the temperature scoring, we created a tool following the SBTI methodology that will give you a competitive score of a portfolio investment based on some specific data, which is the false example that I'm showing you of a very large list. But at least that gives you an idea that at MathWorks, we are very focused in every climate related topics and application. And we would be more than happy to work with any one of you that are also focused on climate. Thank you very much.
Featured Product
MATLAB
Up Next:


Related Videos:


Select a Web Site
Choose a web site to get translated content where available and see local events and offers. Based on your location, we recommend that you select: United States.
You can also select a web site from the following list
Americas
- América Latina (Español)
- Canada (English)
- United States (English)
Europe
- Belgium (English)
- Denmark (English)
- Deutschland (Deutsch)
- España (Español)
- Finland (English)
- France (Français)
- Ireland (English)
- Italia (Italiano)
- Luxembourg (English)
- Netherlands (English)
- Norway (English)
- Österreich (Deutsch)
- Portugal (English)
- Sweden (English)
- Switzerland
- United Kingdom (English)