Playing with Pixels and Visualizing Voxels – Working with Images in MATLAB
Overview
Are you a student or a researcher interested working with images? MATLAB® provides a comprehensive set of reference-standard algorithms and workflow apps for image processing, analysis, visualization, and algorithm development. You can perform image segmentation, image enhancement, noise reduction, geometric transformations, image registration, and 3D image processing.
Highlights
- Image acquisition and importing image datasets
- Basic image processing and visualization
- Feature extraction and quantification
About the Presenter
Praful Pai, PhD
Education Technical Evangelist, MathWorks
Praful works with the Education Team at MathWorks India, where his focus is on collaborating with faculty, researchers, and students to make STEM education engaging and accelerating research in science and engineering.
He completed his undergraduate studies in Biomedical Engineering from Manipal Institute of Technology, and his MS and PhD from the Department of Electronics & Electrical Communication Engineering at Indian Institute of Technology, Kharagpur. Prior to joining MathWorks, he worked as a Research Scientist with the National Brain Research Centre, Gurgaon on developing an MRI brain template for the Indian population. He is passionate about learning, teaching, and research in multi-disciplinary domains involving instrumentation, signal/image processing, statistics, and machine learning.
Recorded: 3 Nov 2020
This webinar will be on playing with pixels and visualizing voxels, which is-- which will be focused on working with images in MATLAB. Your presenters for today are Praful and Amith. My name is Praful. I work with the education team in the MathWorks India office. And we work with faculty researchers on various domains supporting their curriculum or their research using MATLAB.
Joining me is Amith, who also works in the education team and is based out the India office in Bangalore. Our areas are primarily on computer vision, image processing and machine learning. So for the webinar today, we'll be looking at these three main topics, how we can acquire and import images or image data sets into MATLAB. How can we develop image processing algorithms using MATLAB on? And finally, how can we collaborate with others and deploy our image processing algorithms for use by others?
I have a brief Q&A session at the end to answer any queries. However, in case you have any questions at any given point in time, please feel free to put them in the Q&A section on WebEx. To give you a brief background of-- to give you a bit about my technical background, I-- most recently before joining MathWorks, I worked in the neuroscience domain. wherein I worked on acquiring images of the brain using an MRI scanner.
These images were of different formats. They were DICOM images. They are NIFTI images mostly, which we read from a bunch of patients, more than 100 individuals in this scan. We needed to run a bunch of image processing algorithms to extract only the brain regions. And following that, we needed to register these regions to each other as in align these images from different individuals to each other and average them to get what we know as a template.
And to do this, I use MATLAB as well as Community Toolbox based on MATLAB on its SPM. So this is what we used in converting these individual images with a lot of detail to these average looking images which can be used for a bunch of tasks, such as in EEG processing, in fMRI localization, and so on.
Finally, I also developed a GUI for taking this image processing algorithm and enabling other researchers to develop their own templates or work with this template for their specific tasks. So given this brief background, I was able to map these things that I did into these specific steps.
So whenever walking on an image processing algorithm, what are the main challenges that you face? We'd like to no more from you yourself. So please use the polling option to choose an appropriate option right now. So let's go ahead with the presentation, which covers these same aspects. In any image processing tasks, there is a particular workflow that you might follow.
You may need to access a bunch of images of either individual image files or images from a particular software repository, software repository. Or you can maybe take on images from hardware itself. You may also-- there's a second step. You may-- you'll focus on developing your image processing algorithms yourselves, wherein you'd look at analyzing a bunch of data or doing some algorithm development or to maybe reprocess the image, denoise the image, maybe derive some sort of features from the image, which you can use for other tasks, maybe-- or detect what objects there are in the image and so on.
You may develop some sort of applications based on these algorithms that you come up with. And finally, there is the shared step wherein you report your results out either in the form of a paper or a book, which you can publish, or in the form of applications which integrate with other languages, and so on and so forth.
So this workflow is the typical technical computing workflow, which is there across different data types. And for images, it's the same as well. Typically, you would need to automate on this workflow over and over until we get the desired results, which we are happy with. And this is where MATLAB comes in.
For this webinar, we focus on a bunch of image processing apps which are available in MATLAB, which can help you do your image processing algorithm development in an easy manner. In addition to using these apps, you can obviously code your own image processing algorithms. Or you can also export code from these apps and combine it with your own code. We'll look at how we can do all of this shortly. As you can see, all of these apps that are available in the apps tab in MATLAB. And you have a bunch of image processing apps from your camera calibration apps to the volume viewer app.
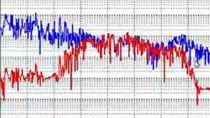
Looking at how other users are already using these same apps, we look at a bunch of user studies. The University of Nottingham and AstraZeneca R&D-- they accelerated clinical research on hyperspectral images using MATLAB, wherein they used MATLAB and Simulink to develop advanced algorithms for taking on these images, the regular images, into saturation maps like the ones shown in the middle.
And these maps were used by researchers and doctors to detect of oxygen regions of the body which had higher oxygen saturation in comparison to the other. You can definitely read more on this using the link highlighted in the slides. NASA, on the other hand, looked at early warning developing an early warning system for detecting forest disturbances from bunch of sources, such as insects, droughts, storms, blights, and wildfires.
That last one might ring a bell because there were a bunch of them across the board in different regions ranging from the US to Australia and even in India. So in this case, NASA used MATLAB to process multispectral satellite images and constructed time-series database lines to analyze tons of data to detect such disturbances.
The result of using MATLAB was they could try out different algorithms and test these in hours instead of weeks and months. And they save a lot of development time this way. And they could repurpose the algorithms that they used and also share it with the user community so that they can adapt it for their own local use case.
And finally, this is a MATLAB algorithm. This is a MATLAB use case when the researcher at University of Haifa developed an algorithm called Sea-thru, wherein they took multiple images of the underwater scene, built 3D distance maps using a separate photogrammetry software, and then encoded that 3D depth map as well as the original images and removed the distortion and introduced by water.
The effects, as you can see, are quite phenomenal, with the image on the left showing how it looks in the water while if the effect of water is removed, how a coral reef might look. The same is shown in this link over here, in this GIF or GIF over here. Then you can see the effect after removing-- you can see the image after removing the effect of water. You can read more about this on the blog post over here as well.
So you can imagine how a use case like this can help a whole community of marine biologists to understand coral reefs better, see what effects other environmental factors are having on them, and how efforts to save these coral reefs can turn out, or what effect the efforts to save these coral reefs are having.
So coming back to the technical computing workflow, let's look at this first step of the workflow, the access bit, wherein you are accessing a bunch of data using MATLAB. So if you were looking at integrating hardware into MATLAB for capturing images, MATLAB supports a wide range of USB cameras. So you can have interface regular webcams, like the ones of any manufacturer, or cameras with some lens mechanism to adhere, or even advanced specific cameras like the infrared cameras from FLIR and so on.
The Image Acquisition Toolbox supports all of these with a bunch of acquisition modes and buffer management options. And you can even synchronize multiple acquisition devices with each other and trigger them as per your requirements. You can read more using the hardware support on the hardware support pages that we have.
You can also work with a bunch of standard image formats, wherein you can read or write image files. You have your typical 2D image file format, like your BMP, the JPEG, of PNG, which you can read directly from your local disk, from a URL, or even from the cloud. You can also work with 2D or 3D file formats like DICOM, NIfTI, or Analyze, or even PCAP files generated by a Velodyne LIDARs.
For hyperspectral images, you can use the multibandread options to read and process these files. And you can work with videos-- with a bunch of different video formats across different platforms. So these are just some of the extensions that are supported in MATLAB. But it supports a lot more officially, and you can also find a bunch of community generated read image-- reading options, which are available on MATLAB central. In the image feeding, you have the image browser and the DICOM browser apps which you can definitely use for going over these images.
Now, let's focus on the second step of exploring and discovery or developing your image processing algorithms. So this where we'll jump into MATLAB and we'll show how we can do a bunch of things with your-- with the images that we just captured. So the first demo that we'd want to take you to is on detecting cell morphology.
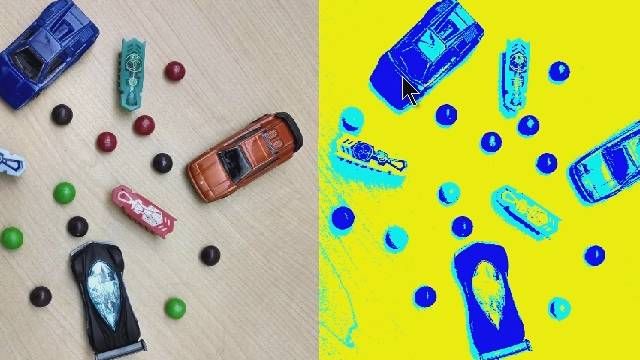
So in this case, we would want to import images of cells taken by a regular camera or maybe a special optical setup that has been developed by the researchers. So these cameras generate an image, a grayscale image like the one you see on the right wherein you have a bunch of circular cells which are shown against darker or varying background, I'd say.
Or the image that you acquired might be a colored image like the one shown on the bottom right, wherein you have a relatively lighter background, and the cells up here are dark with some color as well. So in view of this, how would you go about detecting these individual cells?
You may want to import these images first into MATLAB. You can do that one at a time using simple image reading functions, or use an image data source to read an entire image. You can also use an image-- the Image Browser app to kind of go over these, as we'll just see. Following the reading, you can just look at maybe what each region looks like using the Image Viewer app.
And finally, segment individual cells in these images using a bunch of other apps, typically image segmenter and the color thresholder. Once we develop some sort of segmentation algorithm on maybe one image, we may want to scale it to a bunch of other images. And then we can do that using the image batch processor app which is there. Yeah.
Let's jump into MATLAB and see what we can do right away. So this is what the MATLAB interface typically looks like. So you have your current folder-- which houses a bunch of data-- you have your workspace, and you have your command window. Let us read an image directly into MATLAB called cell.tif.
An image is nothing but a matrix of numbers. And each of these numbers represent the intensity value of the image. In this case, the first pixel in the image is-- has an intensity value of 118, and the next one is 116 and so on and so forth. If I want to see this image, I can just simply type in imshow followed by the variable, which opens up the image in a window over here.
Now, this was if we wanted to read just a bunch of-- just one single image. What if we want to read a bunch of them? So in this case, what we can do is we can simply use a bunch of apps that I mentioned earlier. So let us go over these. So I'll use and I'll go to the apps tab and scroll through them. You can see that there are a bunch of image proxy and computer vision apps.
So let's look at the image browser app first. So if you go and open the image browser app, now here, as I'll walk you through these apps, understand that you do not need to focus on where I'm clicking, but rather on the process-- the underlying process of reading the image, processing them using a bunch of algorithms, and then exporting the results.
So instead of focusing on where what click generated what action, that-- the objective is to show you what the path of these apps themselves. So the image browser app is open now. Now we can load in either an entire folder of images at a time, or you can even load a folder, include the subfolders that are in there. Or you can do something called an image data set.
Let's forget the third option for now. Let's just load these folders here. So I'll load a bunch of images from a folder. So I have this folder called cell processing, inside which there were a bunch of images that I had. If I just select this, the image browser app will read all of them and it will show you all of these.
Let me just see a preview of what it looks like. So this looks like the image that I had up on the slide, where there were a bunch of cells which are against a dark background. You can maybe change the thumbnail size and so on and so forth. But now, you can see that you can export all of these images as an image data search.
So I'll export all of these into our data store, which is named as, say, cellprocessing, or cellimages. I click OK. Now, let's go back to MATLAB and see what it did. Now if you see in the vault space, I have a variable called cellimages whose value is-- it's a 1x1 image data search.
If I just double click on this, you'll see that it has a bunch of properties inside it called files, folders, and so on and so forth. I can close this variable browser and just show you what it looks like. If I just enter the variable name over here, it shows me that the image data stored has the following properties.
There are files here. And it shows me three file names followed by seven more. So it has 10 files in total. And if we just saw this folder, we can see that there are ten image files over here, and then what folder it belongs to and a bunch of other options. So this image data store can be thought of as a pointer to this location followed-- which points to each of these individual images, which points to all the collective images. And then you can run through each of these individual images one by one.
So now what you can do is now, let's look at the image viewer app right from the image browser and examine this image. So opening up the image viewer, let me just zoom this up a little. So now you can see this image in a little more detail. So we can go over a bunch of options here. So now if you just want to maybe preview or navigate the image, you can see that if you have a big image, you can use the image viewer to kind of navigate over the different parts of it.
If you want to look at each pixel value, say, let us examine the pixel values around this white dot over here. So you can do that and examine what each of the pixel regions look like. So as you can see, you can zoom in and zoom out. And you can see the individual pixel values around this white dot are in one-- in the range of 190s, 180, and so on, while in the surrounding regions, it's around 60 to 70.
You can also learn more about the image right from the image information tool. So in this case, the width of the image is something like 640 pixels. The height is 480. The class of the image is an unsigned integer, an eight-bit unsigned integer and so on and so forth. Now, what if I wanted to adjust the contrast of this image?
I can simply do contrast adjustment right away. Just click it from here. And work with this to adjust the entire contrast of the image such that the image-- the detail in the image, and we adjust. I can simply slide adjust data. So this shows me a histogram of the image. And I can modify this to vary your-- vary the image intensity. And it just might contrast.
Now, if you want to select, say, maybe measure a bunch of these image features over here, what you can do is you can use the distance measurement tool over here and just measure, say, the width of this in voxels. So you can simply measure the diameter of these cells. So in this case, the diameter is somewhere around 55 pixels and so on.
You can-- if you want to crop this image further, you can also do that by using the crop tool, selecting the region that you want to crop, right clicking, and confirming your crop. So this crops the image right away. So you can see that this image viewer itself provides you with a bunch of tools which you may want to work with.
Now, image-- enough with the viewing. Let's do some processing. Let's look at this other option that is there. That is the image segmenter app. So if we just open that up-- so the image segmenter opens the corresponding image. And it says, would you like to increase the contrast? And so it will adjust the image data.
So this is the same as the contrast adjustment option that I just showed you earlier. But this is an automatic option. Let's just click maybe no and go over the images that we already have. So here, you can see that you have your segmentations and your history up over here. Now, you can segment this image into the cellular regions as well as the background using a bunch of options over here, which are in create mask.
So you can either create-- apply a threshold. And you click on threshold. The MATLAB automatically computes a global threshold and applies it. Now you can see if you see the mask over here, the white regions are the object while the dark regions are non-objects. So a lot of background is still selected as the object, which is wrong. So we may want to kind of adjust the threshold.
So let us maybe go with an adaptive threshold and see what it gives you. So soon as we went to the adaptive one, you can see that the white regions-- that is, the cells were highlighted as the objects. But along with it, a bunch of other things in the background-- these white dots. And then the smaller white dots were also highlighted.
So if I just see these objects, maybe the-- my thresholding is very sensitive that it detects even these small changes. So I may want to decrease my sensitivity of it. So let us try and decrease it a bit and see what it shows. I think these results are pretty good. So maybe I'd go ahead and create a mask out of it. Let's go ahead and create a mask.
So this is what my thresholder image looks like. If I want to create a new segmentation, I can simply go ahead and maybe create a new one. And if I want to, say, apply another algorithm, say, maybe a graph cut-- so then you can simply do that. Now, in this case, what I do is you have to-- I can mark out foreground and background objects and work with those.
So I mark out foreground, which is the cells that I'm interested in. I mark the background. And you can see that this itself kind of created a bunch of segmentations for me. So you have your cells, which are marked in light blue, and your non-cells, which are marked here.
So now, I can simply go ahead and maybe create a mask out of it. Or maybe-- yeah. So now, I can export these images themselves, or I can generate a function of it. Let us try both of these options. So I can export these images, wherein I can export the segmented image as well as the masked image. And I can generate a function out of it.
What this function does especially is whatever I did using the segmentation bit, it outlines those same steps in the form of MATLAB code. So I can go ahead and save this as a-- so I can go ahead and see this as the MATLAB function. So let me go ahead and make it segment image one. So no.
Following this-- so you-- and if you just go back here, you'll see that we got the masked image as well as the mask itself, the segmentation mask itself. Now, what if I had to do this on a bunch of images? And that is-- what I'll do is I'll go with the image batch processor app.
So let us open up a batch processor app. And let us load these images in. So it will ask me to load images directly from a folder. So in this case, let me just browse and select the same folder. It loaded all of these images in again, similar to the browser app.
Now, what is the function that I want to apply on these images? So I can simply go ahead and specify the function that I just created. So I build segment image one or segment image itself and open it. And then I can apply the entire-- the same operation on a bunch of these images. Or I can either process just the selected image. Or let me go ahead and process all.
So while processing these images, I can use this use parallel option to accelerate the processing. So in this case, I only have 10 images with me. But imagine if you were doing this on hundreds or even thousands of images. Then you may need to accelerate the time in which this happens. In case you're working on a computer with multicode CPUs or a GPU, then you can automatically-- then you can use this use parallel option, which will automatically direct MATLAB to use these resources to accelerate your computing.
In this case, my computer does not have one. I'll go ahead with just a regular serial processing. So once I start that, you see that instead of processing selected, let me go ahead and process all. So here, there is the progress bar over here, which shows all of them have been processed.
And if I just query these, you'll see that the output results kind of all displayed over here. And these change from the image to image. So this change in the image is just the result of us applying the same algorithm that we developed on only one image to all of the images in this folder.
I can choose to export all of these results to the workspace, or export all of these as two files. So let me export it to files and cells. So here, I can control the format of these files. So let me just do maybe a PNG. Let me just go inside the folder and save it.
Now, as I examine the same folder, cellprocessing, you can see that each of these images also has a corresponding output image, which, if I open outside of MATLAB, look somewhat like this. So this is the mask image. Now, if I apply this mask image on the original-- I apply this mask image on the original, which looks like this, I'll be able to isolate these regions.
You can do the same thing using on a color image which looks like this. But enough on that for now. So let's move to a more complex image, maybe a 3D image or 3D CT image. In this case, the objective is maybe reading the lung CT image. We look-- we can import these lung volumes into MATLAB either one at a time, or using image datastore to import multiple.
We can read DICOM and NIfTI images directly and examine them using the DICOM browser app or the volume viewer app. Following this, we can also segment these regions using the image segmenter app. Now, let us look at how we can do this. If we open up MATLAB again, this case-- yeah.
So I load up chestvolume directly, which is already there in MATLAB. However, if you want to read your NIfTI images, you can use the read NIfTI write commands or functions. This is what we call a live script, which contains rich text as well as code. I'll load the chest volume here. And as you can see, this chest volume is of size 512 plus 512 plus 318.
And it's loaded in this variable called b. Now, what I can do is I can view this chest volume using the volume viewer app. To open the volume viewer app, we can simply log in to the apps tab, go to the volume viewer, and import the volume. So in this case, my volume is already present in the workspace. So I'll go ahead and imported from workspace.
So this opens up a 3D volume with individual x slices of the image. So this is a 3D image of the lung constructed by individual 2D slices of the lung. So each of these slices can be treated as individual images themselves. So what we can do is we can look at different rendering options.
We can simply change this with a CT bone, which highlights the bone options over here, which shows the bone regions and removes the soft tissue regions with the help of this transformation. And I can modify these to maybe get a slightly better sort of image. So earlier, where we could not see all of the bone, you can see that maybe it's a bit more clear than now, but there are other muscle tissue, which has also come in the way. So you can do that.
You can also look at just seeing individual slices as well. And vary your-- and the way it will slice this using slice numbers through these options here. Now, we can-- let us-- the objective that we have to segment the lung from these volumes. So what we can do is we can maybe select a plane in the x-- select the image from the xy plane, which has these lung regions.
So let us maybe select this one and select something in the xz plane, which has the same. So maybe this one. And let us export these. So in this case, we can export these individual slices, and yeah. So now, here, getting back, what we can do is let us-- we can-- now go ahead and open up the image segmenter app and see how each of these volumes appear.
So this is what a single volume appears like. So now if we go back here-- so you can see your xy plane and xz planes were here. And we can use the image segmenter app, load this image from the workspace, say, the xy plane image, and adjust the contrast, and use something like graph cuts to isolate the lung regions from the rest of it.
So we can simply mark the foreground and mark the background as well. So with this, you can see isolated these regions pretty well. So you have only the lung segmented as your-- you only have the lung segmented. And now your background and everything is removed by using this simple task.
Now what we can do is we can repeat the same thing. We can create a mask. We can repeat the same thing for the other image from the yxz plane and do a similar segmentation over here of-- again, select the same option. So you mark the foreground regions, mark the background regions.
So as you can see, some regions were-- still appeared as this. And we can simply remove these using additional segmentations. As soon as we do that, now if I create a mask, you can see that only the lung got highlighted. So I can export this image as well as the xz segmentation and xz mask.
Now what you can do is you can do a bunch of morphological operations on these to fill up any holes. So say I have this image. So what I can do is I can say do a morphological operation to define this mask further. So in this case, I can go ahead and say, do a dilate operation, which can-- it will fill up any small holes which were there. So I can modify this operation and use a bunch of other options as well.
So instead of opening. I can remove smaller holes. Yeah. So you can use these to kind of even refine the mask that you generated for that and apply these. Once you have done that, you can come back to your-- to MATLAB. And you can use these 2D segmentations from the xy and xz plane to create an active contour.
This active contour will use these as seed points, these mask regions as seed points, and try to fill in the entire image plus the lung regions and the entire image. So if I just go ahead and click on this-- so this will take in the original volume along with the mask as input and try to fill in the entire volume.
So this will take a bit of time. In the meantime-- so this is what the final output looks like. So you have only your segmented volumes over here. And the other options-- and the other issues surrounding the image have been removed. You can also kind of go ahead and maybe compute the volume of this entire-- the entire lung volume by looking at the individual spacing in the x, y, and z directions for the three voxels, and then computing volume for the entire segmentated feature.
So here, we saw how we could import images into MATLAB. Use the volume viewer app to explore the 3D image. And then use the image segmenter app to segment parts or slices of this image. And then take these masks or segmentations and go back to do a complete 3D segmentations. So this, again, is part of an example over here. So I saw some questions regarding whether we will share the script files. We will share the presentation and you can go what these things.
So in the meantime-- so now that you've gone over these two demos, what image processing are you currently working on? Please use the polling option to address-- to write us an answer. And in case you have any questions, please enter them into the Q&A section, and we'll try to address it during the Q&A at the end of the presentation. I'll now switch over to Amith, who will take you through the final demo and image registration, and also share with you a bunch of resources on how you can get started with all of this.
Thank you. Thank you, Praful. Hopefully, you can hear me OK. So Praful is going to be-- while you're answering the poll question, he's going to be transferring the presenting privilege to me. And I can hopefully then start presenting by today. So all righty. So hopefully, you can see my screen now, and I'm going to move to the presentation mode.
For your reference, again, the poll question here is what image pressing problem are you working on? You can choose multiple options, I believe. So please go ahead and fill it out. Looks like the polling has ended, which means that you all hopefully answered, and then we can make progress here in the presentation.
So for the next 15 to 20 minutes, what I'll try to do is I'll walk you through another very common problem in the image processing world. This has to do with image registration. So there was a question earlier in the Q&A about how do I find the intersection of two images, for example? And so this section is hopefully going to throw some light into that problem and how to address that.
So here's the problem statement. So you see this image here on top, right? So this is-- imagine this is an old reference map, meaning this is a satellite image taken maybe a few years ago. And when you look at this image here below, notice that in this region where there was what you should believe me is greenery, there's a new construction here.
And so the question is when you've taken an image like this in the past and another image like this, how do you sort of align them and put them together and then get a sense of what has changed in the two? So that's the problem statement, and that's what we'll try to address in this particular demo.
The general field-- if you're interested in learning more about-- is called image registration. And fortunately, we have an app, like most other well-known workflows. We have an app or for making the process of analyzing this easy. So the app's name is called registration estimator. And generally, the idea is this is-- may look straightforward, but it's quite challenging.
So aligning the space may not be straightforward. For example, your new image with the construction may be rotated as compared to the original image. The new image may be translated, may be moved along the x and y-axis as compared to the original image. Or it could be skewed as well, meaning you may have zoomed in or zoomed out.
In reality, your camera parameters might be different, and so they may be nonlinear distortions as well. So there are several challenges, and there are several well-known and well-understood algorithms that can deal with these cells as well. So our objective, again, is to transform and align the image pair before performing this quantitative kind of analysis.
So here's a very brief one minute overview of how image registration works. So essentially, what we do is we find something called interest points. These are fairly descriptive points in each image which are very unique and can describe what's in the vicinity of these regions here. So imagine these to be some kind of-- some features.
So you may have heard of the term feature in potentially machine learning. So these are features, and that location is sort of the identity along with the pixels in its neighborhood. What we do then is we find a bunch of these points in both the images. We then find the features themselves. So on certain points like here, the features might be very-- spatially very, very close together.
But in this point, for example, the features may be computed from a larger region. Then what we can do is we can do something called matching. So depending on the statistics of the features in each of these points, we can sort of match the two. And then based on the match, we can find out what region here corresponds to what reason here.
So this is one specific algorithm or flavor of algorithms called point feature matching. There are many others, which I'll point to later on. But then this kind of an algorithm can really help you in problems like these. So if you have two, let's say, medical images of two different modalities, or potentially even the same modality, there is this interesting thing called demons registration.
So this is non-rigid, meaning the transformations are non-linear. And you can do that kind of registration here. If you want to do video stabilization, so you have a very-- you're driving on a pretty bad road and then you want to stabilize your view, you can do that also with this kind of method.
This, I think, is more related to the kind of question that came up in the chat window earlier. You can do panoramic image stitching as well. So, in fact, all these three are examples. And when we share the presentation with you, hopefully you can click on each of these and learn more about how this is done.
I will show this, and then I'll go into MATLAB and show you how this works. But then we have several interactive options. So this is from our documentation page. Essentially, there are a few semi-automated methods where you can actually manually click on corresponding points between two images and then kind of reconstruct this transformation between the two.
There are a bunch of fully automated methods. The feature point estimation is, in fact, fully automated. There are several different types of points that you can compute and features that you can match. There's intensity-based estimators, which work really well for medical kind of data where there are not too many distinct great features at local points. So you'd want more global measures.
And then there is this non-rigid estimators as well for more complex situations. Again, in the medical world, for example, when the shapes of-- let's say you're doing heart images. The shape of the heart itself changes when it beats. And so you'd have to account for that when you do this kind of registration. So there's a lot more which is listed in this particular link right here that you can read up about which method may apply to what kind of problem you're working on.
So I'll go to MATLAB now and show how this will work on these two images here. So let me-- so this is MATLAB R2020b, which is the latest current version. What I'll do is I'll go into this apps tab here, and I will expand this. So this list out all the apps that you have installed spanning a variety of topics.
So what I'd want to do here is do this-- choose this app called registration estimator. So I'm going to choose that. And I have two images in my workspace. I will load them into the app. So there's a load button. I can-- actually, I'll load them from file because they're in my file already. So let me choose-- I think I have to choose concordOld first, and then townDrone next.
So these are the two images that I want to kind of stitch together. If they're not grayscale, if they are colored images, the app will automatically convert them. I'll just slide this segment around it. I think I need to do the reverse, so let me actually redo this. So let me load-- you can overwrite and redo this.
I'll load townDrone first, and then I will load concordOld next. You'll see why this has to be the case later. So here's what happens. So a bunch of these different methods are pre-run for you. And then these corresponding points-- so the green one-- green end corresponds to one of the images. The red end corresponds to the other image. And so these corresponding points are computed and masked already for you.
You can modify this. You can change the number of detect features. You can reuse it. And so you'll see the number of features that it used. You can maybe increase the quality, which will reduce the number of matches even further. But then these are all high quality matches. If you want more features or more matches, you can then use the quality. And now you see there are so many of them.
So let me just pick a high-quality measure. And then what you can do is you can just say register. So just press the register button, and here's what happens. So notice that the original smaller image is now transformed, or maybe use it for projective transform here. Or you can-- if you know it's in the same plane, you can use affine or similarity, for example.
But projective is the most genetic one. So notice how the image has been warped and overlaid on the other image. So now, you can get a much better sense of how they match each other. The cool thing with all of these apps really is there's this Export button here, by which everything that you graphically did in the app, you can generate code to do that.
So I can say generate function here. So depending on the toolboxes that you have, it will generate a code. So here it is. This is the code that's generated, which requires the Computer Vision Toolbox, for example. So that's what's listed here. The other thing too is you can change the type of registration that you want to do.
If you're working on medical images, for example, you can use intensity based. There are other types of feature-based methods. So the default ones are MSER and SURF. But if you want Harris, which is sort of a classical method, you see it may not work very well for this set, right. So maybe I can change some of these parameters and see if there are more features, but possibly not. So there it is. So Harris clearly may not work very well.
So you can explore all these different methods very easily in this particular app. So that's the general idea. So now once you've done this, you've written some code around here to highlight the regions that are different. So I'm just going to run this here and you'll see this particular image here again.
Notice that this is the region that was in the intersection in some sense, which was different, which was-- earlier, there was vegetation. Now there is a building. We can then extract the region of interest. We can do some morphology operations to kind of highlight this region and get rid of these. We can call call that noise, for example.
And then draw bounding box. We use region props, which is a very powerful kind of Swiss army knife kind of function in MATLAB that you can apply to a bunch of different processing operations. And then you can sort of draw-- compute the centroid of this region that's different and then draw a box around it.
So that's generally the idea behind using registration and computing differences or computing the commonality between images and aligning them, for example. So that was the quick, thorough demo that we wanted to show. The one other thing that's these days turning out to be very popular and very interesting is large images.
So those of you who work on digital pathology, for example, or you work on cell slides that are 10,000 pixels by 10,000 pixels large. We have a bunch of new examples which show how you can work on this data without crashing your memory. So you can't on most normal machines load the entire image in one shot at all when you're working that data this-- these dimensions.
So we have ways to-- there's this new function called big image. And we have ways of-- there's another fairly well-known and old function called blockproc, which can process these regions by blocks. That way, the data is loaded only on demand in certain block kind of pattern. And then that particular block, the processing is done on that block first, and then the process output is stored away. And then the next block is loaded and so on. So that way, you can better deal with these larger images and still parallel process this as well.
So if your processing is exactly the same in all these blocks, you can load multiple of them depending on your hardware in parallel, and then process faster as well. So there are a bunch of these. All of these, in fact, are from our documentation page. And this particular link when we share the presentation with you can point you to these particular examples.
All right, so I think we've covered the access part already. We've also covered three examples in the explore and discover part. Now, we'll come to the share part. Now, it isn't a binary kind of decision process that you have to take when you're working with MATLAB. So you can call MATLAB from other languages here, or you can call other languages of code from other languages from MATLAB.
So these are all of the other frameworks and languages that we sort of talk to. And you can add an wrappers to your code in, let's say, Python or C++ and call them as if it was MATLAB code. And there are ways to do that. So there's the next interface. On the other hand, if you want to call MATLAB from Python, there's something called the MATLAB engine, which you can load up from your Python terminal. And you can call MATLAB code from Python as if it was Python code.
So it's really cool that you can kind of make the best use of whatever platforms are available so that your research or your work is actually taking-- it's no longer a this or that kind of a choice. You can use both, whatever works best for your work. So that's one way. The other way is in terms of deployment, when you've built your entire system and you want to now shed the final kind of version with your colleagues or your PI, or your users of your research.
There are ways from MATLAB to deploy and sort of generate standalone code for enterprise systems. You can share it with anyone who does not have a MATLAB license as well using something called the MATLAB Runtime, where there's no royalty associated with it. On the other hand, if you want to sort of generate code for embedded hardware-- let's say you want to put your fancy image processing algorithm onto the next version of your self-driving car. Who knows when that will come up.
But you can generate C, C++ code for example, or HDL code as well. From the same sort of algorithmic base-- so the real advantage of this is the conversion from your tried and tested MATLAB implementation of your algorithm to these other implementations is handled by us. So you don't have to worry about if there are bugs here, there are likely bugs here. And you can test that right here.
And so that way, your design of your system and the pipeline of how you set this up is going to be that much smoother. So that's really the advantage of doing that. Again, royalty-free. You can develop apps as well if you'd like, which we'll show right here. So the apps that we showed you are apps that were built by us, which you can use.
However, if you wanted to create an app for your own use, for your own special kind of process to share with your colleagues, for example, you can define and create elements and develop something like this, for example. You can load a custom image and draw the histogram. This is a very simple kind of an app that you can build.
And we have this thing called the app designer, which is an interactive kind of way to create these graphical elements. The cool part, again, is you can deploy this either as a standalone app, or even a web app these days. So it's very cool that you don't have to learn all these-- several of these different languages and frameworks and technologies and so on, you can just be great at MATLAB, and then there are ways that you can create these kind of end applications directly as well.
All right, so it's not just us and what we develop that might be helpful to you. There are add-ons and there are community toolboxes that you can find on MATLAB Central. And we have a very vibrant community of MATLAB users. If you go to the MATLAB toolbar and click on add-ons here, you'll find a bunch of these additional toolboxes that you can use for GUI layout or DIY layout toolbox.
This was a community toolbox that we did not write, but then is very highly rated and you could potentially find using it when building your own apps. So for neuroscience, for example, there's a bunch of submissions. And so please do explore these areas. If you don't find something that you want to do immediately available in MATLAB, it might live here as well.
All righty. So quickly, I know it's slightly above time, but the takeaways that we'd want you to remember after this webinar is the following. So the first one is you can work with a variety of scientific image file formats across different domains. So Praful mentioned LIDAR, which is sort of in the automotive domain typically these days, although your phone now-- one of the latest versions also has a LIDAR camera in it. So we could use it for that.
Medical images. So there's NIfTI. There is DICOM. There are so many. So different domains-- we have support for reading the data directly into MATLAB. You don't have to worry about installing a package for this and installing another package for that. It's all in one better setup. The other cool thing is data stores.
And so these days, typically nothing really works on a single image. You prototype your algorithm for one image, but then you want to run it on thousands or millions of images in certain situations. And so data stores are sort of the preferred and modern way of handling data on demand and working with large data sets. So learn to love data stores.
MATLAB apps. So some of these workflows that we are very familiar with and we kind of know what the sequence of these steps are are packaged as MATLAB apps. And so if you know that that's what you're doing, you can just simply use the graphical interface, explore around like we did with the registration app, and then simply export and generate function. And that way, you don't have to manually write the function.
You've done your visual exploration, and then the function's generated for you. So the advantage there is really in the image and kind of vision area, a lot of your analysis is very visual. You want to see what the input is. You want to see what the output is. And that is how you kind of know that your algorithm has worked or not. And so apps for this are great to sort of visually explore your algorithm space, and then finally generate code out of it.
Finally, the last two here are live scripts. So you may have heard of live scripts in much more detail in one of our past webinars. So you can document your code and collaborate with others, especially sharing your code with other people either as HTML or even LaTEX. You can do that with live scripts. And finally, if you want to create your own apps, you can use the app designer to deploy your algorithms into several different situations.
Featured Product
MATLAB


Select a Web Site
Choose a web site to get translated content where available and see local events and offers. Based on your location, we recommend that you select: United States.
You can also select a web site from the following list
Americas
- América Latina (Español)
- Canada (English)
- United States (English)
Europe
- Belgium (English)
- Denmark (English)
- Deutschland (Deutsch)
- España (Español)
- Finland (English)
- France (Français)
- Ireland (English)
- Italia (Italiano)
- Luxembourg (English)
- Netherlands (English)
- Norway (English)
- Österreich (Deutsch)
- Portugal (English)
- Sweden (English)
- Switzerland
- United Kingdom (English)