Getting Started | Processor-in-the-Loop Simulations with Simulink and MULTI IDE
From the series: Processor-in-the-Loop Simulations with Simulink and MULTI IDE
Learn how to:
- Install MULTI toolbox for Simulink.
- Configure MULTI and Simulink to run PIL simulations using instruction set simulators.
- Perform your first PIL simulations with Simulink and MULTI.
Published: 28 Mar 2022
Processor-in-the-loop, or PIL simulation, is a popular verification technique for model based design. This video shows how you can perform PIL with Simulink and Green Hills MULTI IDE from the convenience of your desktop. Simulink link and embedded coder let your model, generate code, and perform in-the-loop testing for embedded processors. MULTI lets you compile, run and debug code and physical target devices, as well as using instruction set simulators.
Combined, Simulink and MULTI lets you perform PIL for many targets on your host computer, even before the availability of the hardware. In this video, we will show you how to perform PIL using the instruction set simulator for the RH850 processor. Setting this up is straightforward with the following steps.
First, install the MULTI tool box from Green Hills. Second, configure MULTI to connect with the target hardware. As a final step, configure Simulink to use the MULTI connection.
So let's start with the first step. Find the Add-On Explorer under the Home tab in Matlab, and press Get Add-ons. In the search field, type Green Hills Software. Choose this result and press Add. Enter your username and password if prompted to, and accept the license agreement to finish the install.
To execute the second step, fire up MULTI. Under Components, find the Connection Organizer, and under Method in the new window, you can create a new connection. Let's choose the simulator for V850 and RH850 from Renesas in the type field. Let's give this connection method a name. We need to remember this name for later use. Choose Connect To Target from the context menu to test the connection. A successful connection causes the MULTI debugger to start, and will be added to the list of connected targets.
Now back to Matlab. In the Command window, type multi.setup to bring up the configuration GUI. Select RH850, and press OK. In the new window, provide a path to your installation of MULTI, provide a path to your installation of the target compiler for RH850 from Green Hills, provide the name of the connection, which we have already set up in MULTI. You can modify the compiler and linker flags as required. We will, for now, keep the default values. With this done, we are ready to run PIL in Simulink.
The MULTI toolbox we installed earlier comes with an easy to follow tutorial to run PIL on individual models. Along the lines of this tutorial, we will use an example model from embedded coder. You can start this model by typing rtwdemo_sil_topmodel in the Matlab command window. You need to make sure that you have right permissions in the current folder in Matlab since generated code will be placed here by default.
Let's now configure this model to run PIL. Under Modeling, press Model Settings. First, select Hardware Implementation in the left column, then on the right, select your hardware board. This lets Matlab know what hardware is used, so that code can be correctly generated. Let's choose Green Hills Software MULTI RH850. Now select Code Generation in the left column. Make sure to select the system target file for embedded coder, ART to TLC, and then select the tool chain for the target device. This tells Matlab how to compile and link automatically generated code.
Let's choose Green Hills Software MULTI RH850 tools. Finally, select verification in the left column. Then on the right side, make sure that Measure Task Execution Time is disabled. Save the configuration.
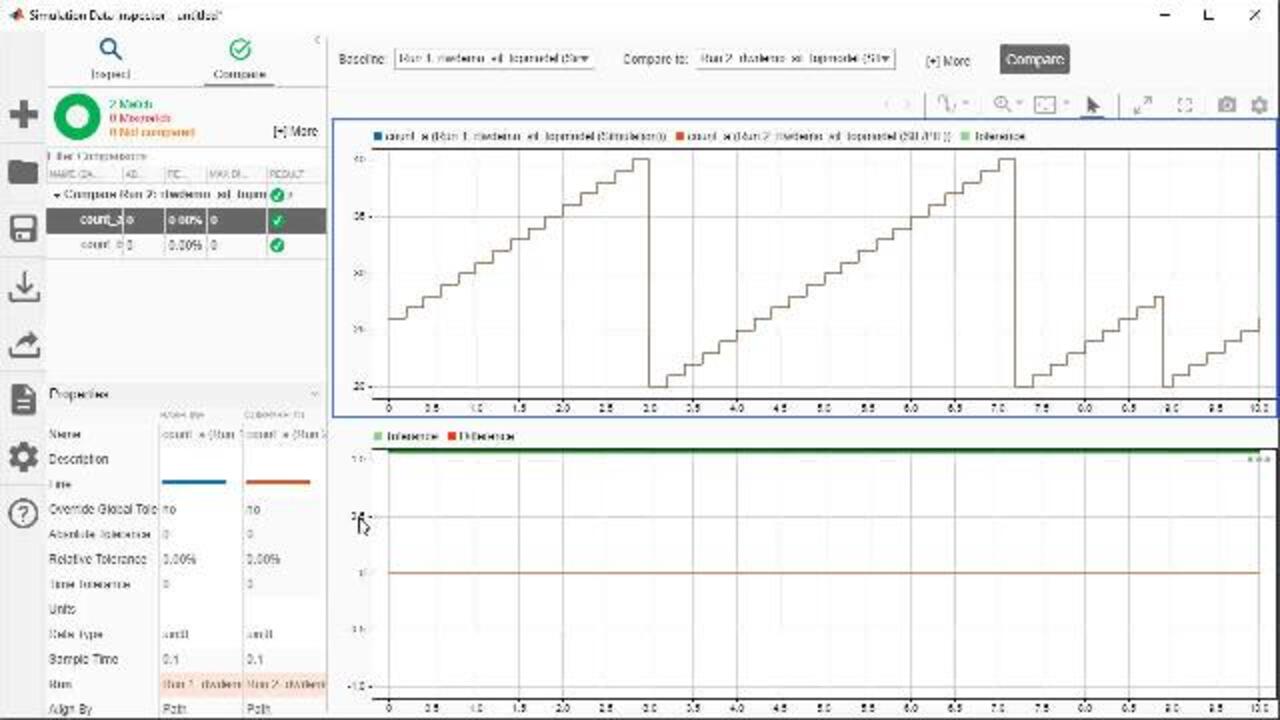
In the SIL/PIL app, select simulation mode to be PIL, and then run verification. This causes the MULTI debugger to start, to handle the communication with Simulink, and to execute the generated code of the model. At the end of the simulation, the data Inspector window shows up, providing a comparison between the MIL and PIL simulation runs. The results validate the numerical equivalence of the model and the target object code.
Let's go back to the simulation model and check the diagnostic viewer to see what is going on behind the scenes. First thing to notice is that Simulink generates code from the model. Simulink then invokes the compiler tool chain for RH850. The rest of the diagnostics show further details on how PIL communication is established between Simulink and the target. Now if you want to simulate a different model in PIL, all you need to do is to configure the model settings to specify the target hardware and compiler toolchain as we saw earlier.
To summarize, in this video, we have seen how to configure your Simulink environment and individual models to run PIL using the integration with MULTI. In the next video, you will learn how to build on this to comply with the requirements from safety standards like ISO 26262 in a large scale project.


Select a Web Site
Choose a web site to get translated content where available and see local events and offers. Based on your location, we recommend that you select: United States.
You can also select a web site from the following list
Americas
- América Latina (Español)
- Canada (English)
- United States (English)
Europe
- Belgium (English)
- Denmark (English)
- Deutschland (Deutsch)
- España (Español)
- Finland (English)
- France (Français)
- Ireland (English)
- Italia (Italiano)
- Luxembourg (English)
- Netherlands (English)
- Norway (English)
- Österreich (Deutsch)
- Portugal (English)
- Sweden (English)
- Switzerland
- United Kingdom (English)