Using the MATLAB Interface for Databricks
Published: 8 Oct 2021
What you see here on the left is the MATLAB desktop product. And at the same time on the right is the Databricks. I just signed into my Databricks account. Spinning up a cluster can be as simple as a few lines of code where I can set the scale of my cluster to, let's say 10 workers.
If I did ask it to run the section, what I've done here is actually spun up a new cluster. And the MATLAB session over here has communicated, if I refresh my right hand side, for example, I've just spun up my cluster here of 10 workers and it took about five lines of code.
That is the power of what Databricks enables. For people that are manage their own spark clusters, it is really very painful and Databricks removes that pain by actually making it extremely simple, as simple as five lines of code of a declarative way of actually defining and configuring it. With that said, I'm going to put away the right hand side because what I am doing here is actually happening on the back end Cloud system.
But since you understand that now, what I should be able to do is connect up to a certain data set -- I've actually placed it on cloud storage. This is all sitting on S3. -- and import the necessary Spark session in MATLAB. In this particular case, I'm going to go through and create a Spark session, allowing me to connect up to my delta format or my parquet-based format, and look at my data.
So if I were to run the section, what I've done here is actually sliced and diced my data and very quickly visualized it. In this particular case, this is what my data looks like. If I wanted a larger slice, I'm actually getting maybe a slice of my data, bringing it into MATLAB for a very quick exploratory analysis. This is one sensor value on a piece of equipment. From which, at this point, you can actually have a whole bunch of domain specific features.
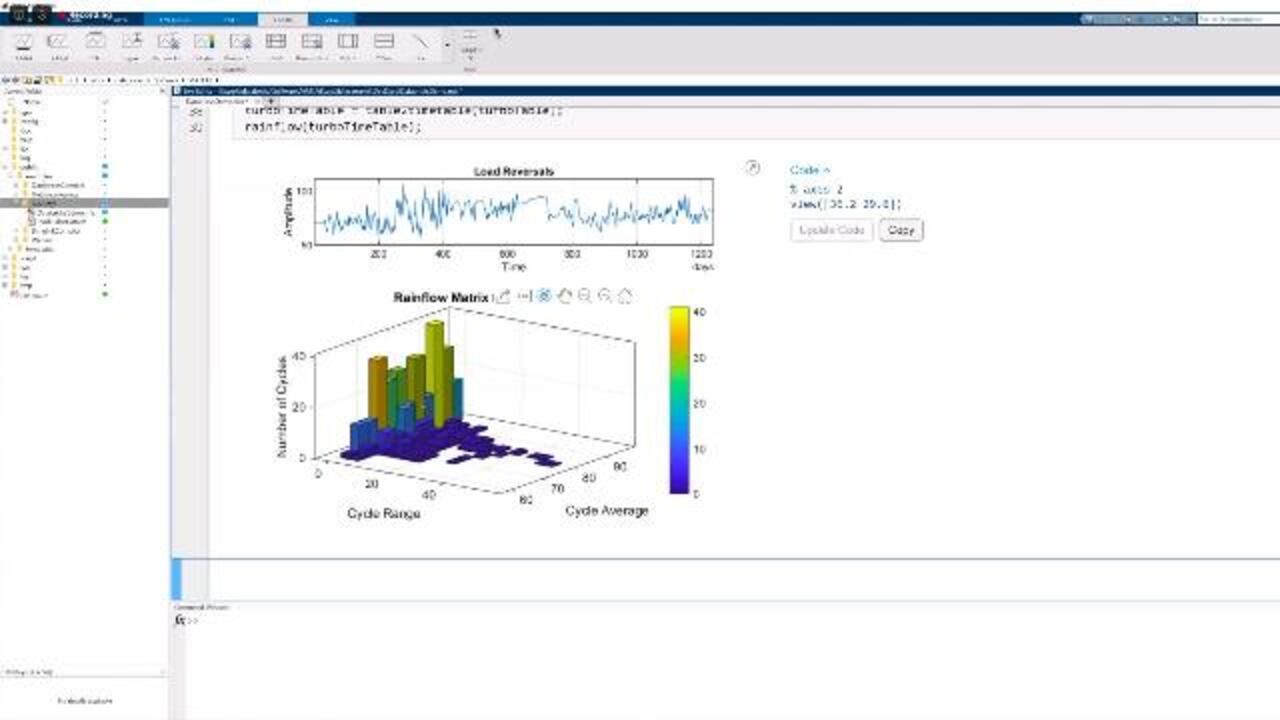
For example, building a predictive model for this. You should be able to connect up to a certain slice of the data and some of these functions this performs in ASTM standard cycle count for predictive maintenance that comes out of a predictive maintenance toolbox that will allow you to predict how much remaining useful life there is on a certain piece of equipment.
So along with the ability to crunch the numbers, you do have the ability to hook into the big array of domain-specific visualizations. For example, this shows that particular signal. And if you needed to, you could actually visualize it see exactly what your cycle range average is, understand the data, and explore it. But once you actually have a model in place, you can then go through the process of actually compiling it and then pushing it down to Databricks.
This is a small slice of a much larger workflow that we don't have time for today, but I wanted to give you a taste of what the integration looks like because I do believe that a demo is usually worth a thousand words.
Featured Product
MATLAB
Up Next:


Related Videos:


Select a Web Site
Choose a web site to get translated content where available and see local events and offers. Based on your location, we recommend that you select: United States.
You can also select a web site from the following list
Americas
- América Latina (Español)
- Canada (English)
- United States (English)
Europe
- Belgium (English)
- Denmark (English)
- Deutschland (Deutsch)
- España (Español)
- Finland (English)
- France (Français)
- Ireland (English)
- Italia (Italiano)
- Luxembourg (English)
- Netherlands (English)
- Norway (English)
- Österreich (Deutsch)
- Portugal (English)
- Sweden (English)
- Switzerland
- United Kingdom (English)