Visualizing Data with MATLAB
From the series: Data Science Tutorial
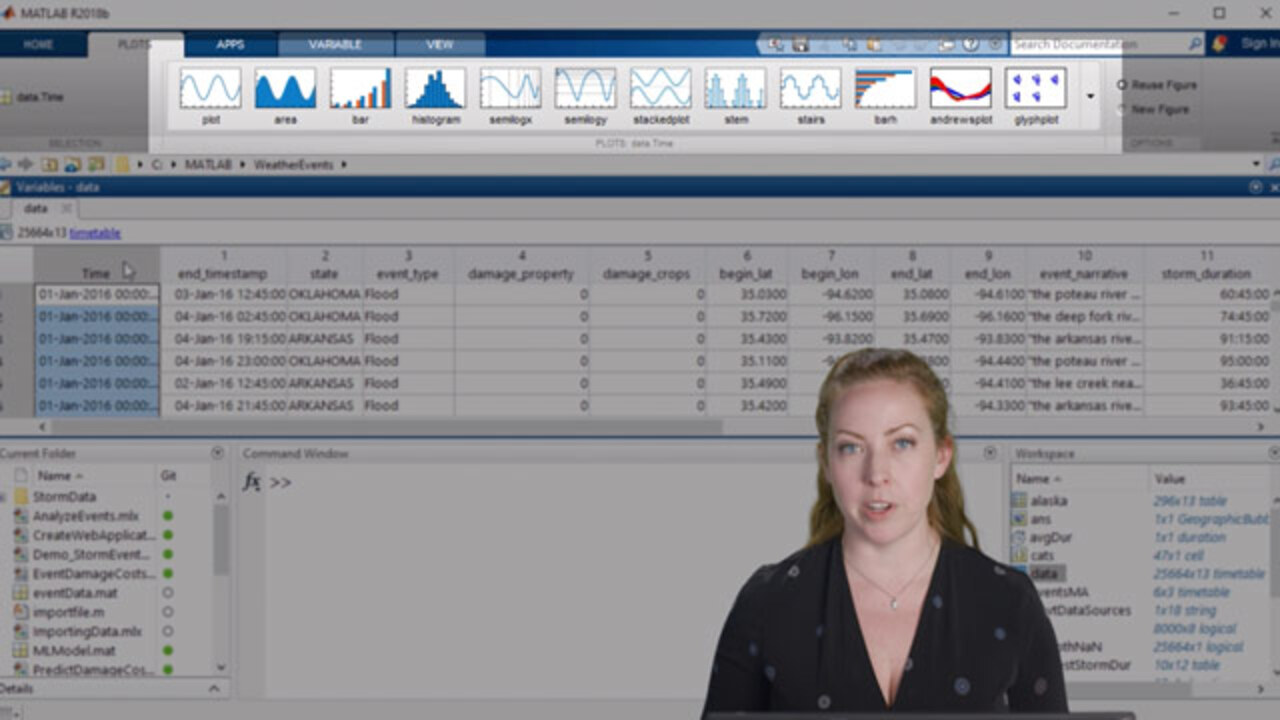
Use MATLAB® to explore and visualize your data. You can visualize your data in different ways depending on your data type. This video walks through several common methods and visualizations.
Walk through how to select different plot options. This video uses a weather data set to determine patterns in storm events based on frequency, damage costs, and locations. You’ll learn how to easily switch between plots, and you’ll see how to edit, explore, and modify your visualizations.
Published: 4 Sep 2019
Related Products
Learn More


Select a Web Site
Choose a web site to get translated content where available and see local events and offers. Based on your location, we recommend that you select: United States.
You can also select a web site from the following list
Americas
- América Latina (Español)
- Canada (English)
- United States (English)
Europe
- Belgium (English)
- Denmark (English)
- Deutschland (Deutsch)
- España (Español)
- Finland (English)
- France (Français)
- Ireland (English)
- Italia (Italiano)
- Luxembourg (English)
- Netherlands (English)
- Norway (English)
- Österreich (Deutsch)
- Portugal (English)
- Sweden (English)
- Switzerland
- United Kingdom (English)