What Are Categorical Arrays in MATLAB and How Are They Used?
Categorical data are values assigned to a finite set of discrete categories. The purpose of this video is to define categorical data, import it into MATLAB, change existing data types into categorical data, and demonstrate how to analyze and manage it using categorical arrays.
Published: 3 Nov 2020
Welcome to categorical arrays in MATLAB! In this video, we will be working with categorical data. The purpose of this video is to define it, how to import it into MATLAB, how to change existing data types to categorical data, and how to analyze it.
Let’s first review the definition. Categorical data are values assigned to a finite set of discrete categories. Categorical data exists all around us. Perhaps you’ve taken a survey and you had to describe your level of satisfaction by choosing between 1 and 5, or from excellent to poor. Those values are all categorical data values – you’re choosing them from a list. Although there are countless examples of categorical data, you can see that not all categorical data are string arrays – it can be numerical as well.
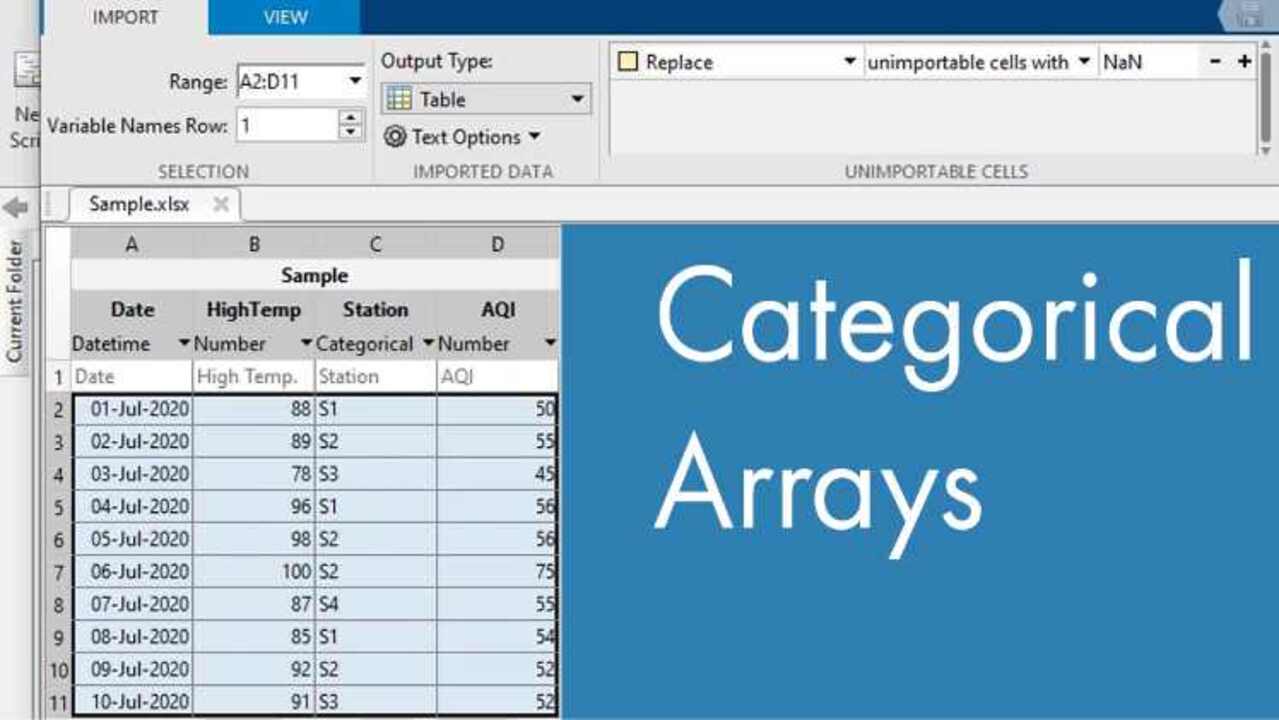
Most likely, you’re familiar with categorical data existing in tables such as Excel spreadsheets. You can import an Excel spreadsheet directly into MATLAB. Let’s use this sample spreadsheet with dates, temperatures, station codes, and the air quality index. In MATLAB, click on “Import Data”, select the table you wish to import, and then click “Open.”
You’ll see a preview of the data imported. In our videos about tables, we reviewed how to change variable names. You can find more information about changing variable names in the variable editor and programmatically in the help documentation.
Underneath the variable name, you’ll see the type of variable. In this example, you see: date-time, number, categorical, and number. Next to each variable type, there is a drop-down menu. In this example, you’ll see MATLAB interpreted the air quality index – the AQI values as numerical data. But, let’s assume we want to make the AQI categorical for further analysis. We can easily do so by using the drop-down menu and assigning it as categorical.
We can also do this programmatically. Let’s assume we didn’t change the variable type when we imported the data. Using the categorical command and dot indexing, we can assign the AQI variable as categorical using the categorical function
What if you want to change category names? This can also be done programmatically. In the Station category, we have S1, S2, S3, and S4. Perhaps we want to rename these station codes to locations?
For this, we can use the renamecats function. But first, it’s best to view all the category names associated with a categorical variable, especially when working with a large dataset. We can do that with the categories function.
Here, let’s let A = categories(catsample.Station)
You’ll see we have four category names: S1, S2, S3, and S4 listed in the order in which they first appear
To change this to locations, we’ll use the renamecats function to replace the station codes:
Once the line of code is executed, you’ll see it’s reflected in the table.
There are several commands in MATLAB that provide high-level and detailed analytics of categorical data.
First, to obtain the number of instances an element occurs within a categorical variable, you can use the countcats function. For instance, to view the number of instances stations S1, S2, S3, and S4 appear, we’ll use the catcounts function. You’ll see the function operates using column order
To obtain a high-level overview of a table including a variety of variable types, including categorical variables, use the summary function:
This provides a statistical overview of numerical data and a value count of categorical data.
You can also use the summary function to obtain a high-level overview of just one variable. For instance, if we want to see value counts of the AQI variable, we would use:
You can visually analyze data using the histogram and wordcloud functions in MATLAB. To visually analyze quantitative categorical data, use the histogram function. For example, let’s look at the counts of AQI numbers.
Alternatively, if you want to visually analyze qualitative data, you can use the wordcloud function. For example, let’s look at station data:
You can use the tools in the histogram and wordcloud image preview to adjust colors, add a legend, and export the image for use in other programs.
Lastly, if you want to analyze data specific to one category, you can do so with using the double equal sign. This is exceptionally useful when working with large datasets. For this example, let’s say we want to analyze data specific only to the station in Natick. First, we use the double equal sign to find the values of Station data specific to Natick.
Then, using logical indexing, we display all the rows associated with Natick:
As you can see, there are many ways to use categorical data in tables using MATLAB functions and features. For more information about using tables, table functions, or advanced table programming, be sure to check out our additional videos on tables or use the help documentation for live scripts and examples.
Featured Product
MATLAB


Select a Web Site
Choose a web site to get translated content where available and see local events and offers. Based on your location, we recommend that you select: United States.
You can also select a web site from the following list
Americas
- América Latina (Español)
- Canada (English)
- United States (English)
Europe
- Belgium (English)
- Denmark (English)
- Deutschland (Deutsch)
- España (Español)
- Finland (English)
- France (Français)
- Ireland (English)
- Italia (Italiano)
- Luxembourg (English)
- Netherlands (English)
- Norway (English)
- Österreich (Deutsch)
- Portugal (English)
- Sweden (English)
- Switzerland
- United Kingdom (English)