findpeaks
Find local maxima
Syntax
Description
pks = findpeaks(y)y. A local peak is a data
sample that is either larger than its two neighboring samples or is equal to
Inf. The peaks are output in order of occurrence.
Non-Inf signal endpoints are excluded. If a peak is flat,
the function returns only the point with the lowest index.
[___] = findpeaks(___,
specifies options using name-value arguments in addition to any of the input
arguments in previous syntaxes.Name,Value)
findpeaks(___) without output
arguments plots the signal and overlays the peak values.
Examples
Define a vector with three peaks and plot it.
data = [25 8 15 5 6 10 10 3 1 20 7];
plot(data)
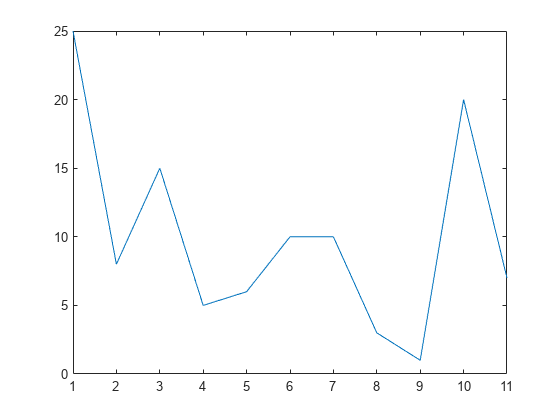
Find the local maxima. The peaks are output in order of occurrence. The first sample is not included despite being the maximum. For the flat peak, the function returns only the point with lowest index.
pks = findpeaks(data)
pks = 1×3

    15    10    20
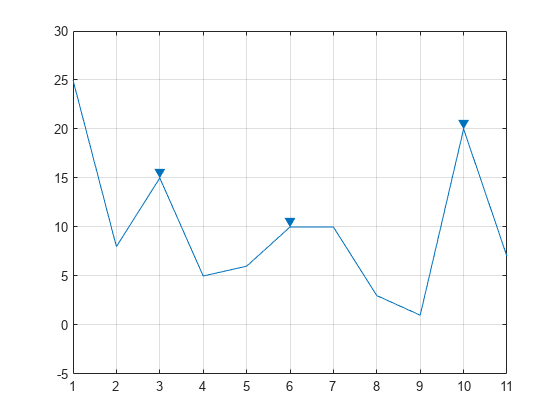
Use findpeaks without output arguments to display the peaks.
findpeaks(data)
Create a signal that consists of a sum of bell curves. Specify the location, height, and width of each curve.
x = linspace(0,1,1000);

Pos = [1 2 3 5 7 8]/10;
Hgt = [3 4 4 2 2 3];
Wdt = [2 6 3 3 4 6]/100;

for n = 1:length(Pos)
    Gauss(n,:) = Hgt(n)*exp(-((x - Pos(n))/Wdt(n)).^2);
end

PeakSig = sum(Gauss);
Plot the individual curves and their sum.
plot(x,Gauss,'--',x,PeakSig)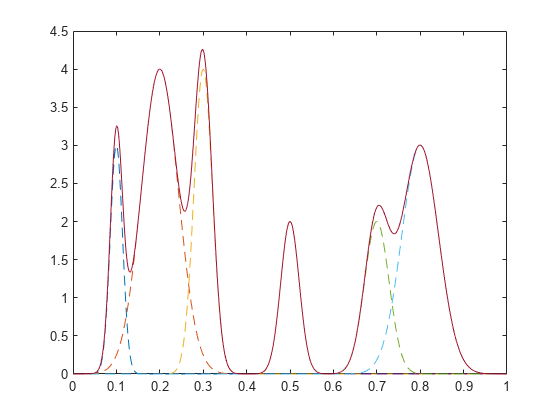
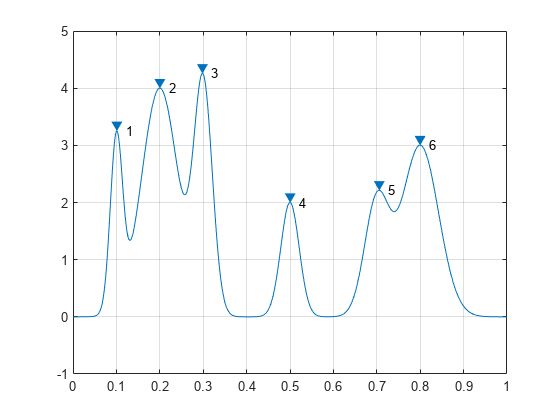
Use findpeaks with default settings to find the peaks of the signal and their locations.
[pks,locs] = findpeaks(PeakSig,x);
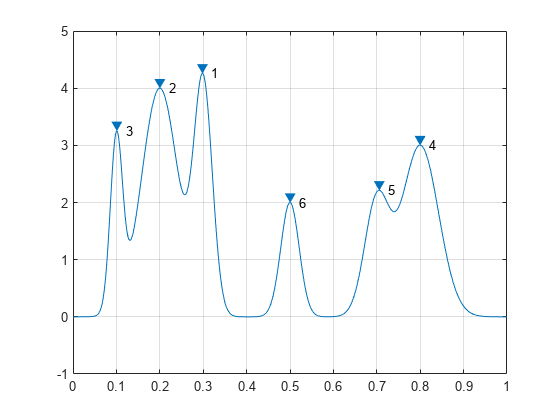
Plot the peaks using findpeaks and label them.
findpeaks(PeakSig,x)

text(locs+.02,pks,num2str((1:numel(pks))'))
Sort the peaks from tallest to shortest.
[psor,lsor] = findpeaks(PeakSig,x,'SortStr','descend');

findpeaks(PeakSig,x)

text(lsor+.02,psor,num2str((1:numel(psor))'))
Create a signal that consists of a sum of bell curves riding on a full period of a cosine. Specify the location, height, and width of each curve.
x = linspace(0,1,1000);

base = 4*cos(2*pi*x);

Pos = [1 2 3 5 7 8]/10;
Hgt = [3 7 5 5 4 5];
Wdt = [1 3 3 4 2 3]/100;

for n = 1:length(Pos)
    Gauss(n,:) =  Hgt(n)*exp(-((x - Pos(n))/Wdt(n)).^2);
end

PeakSig = sum(Gauss)+base;
Plot the individual curves and their sum.
plot(x,Gauss,'--',x,PeakSig,x,base)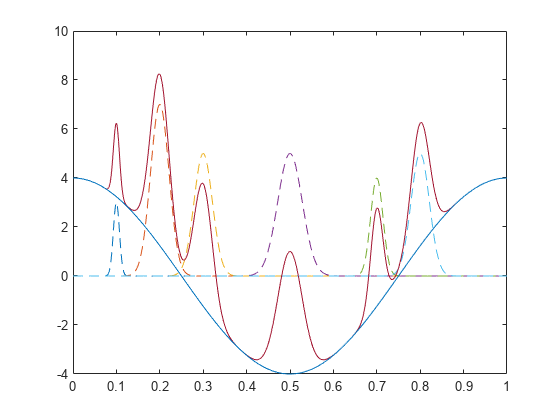
Use findpeaks to locate and plot the peaks that have a prominence of at least 4.
findpeaks(PeakSig,x,'MinPeakProminence',4,'Annotate','extents')
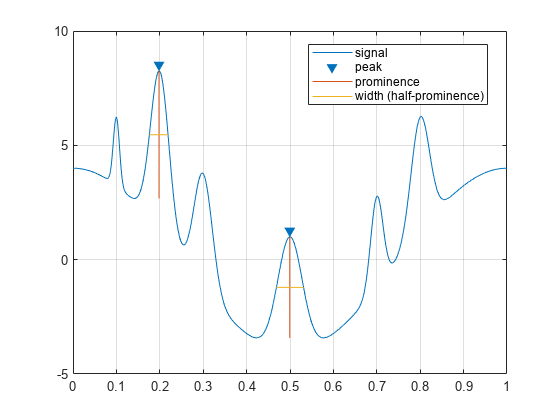
The highest and lowest peaks are the only ones that satisfy the condition.
Display the prominences and the widths at half prominence of all the peaks.
[pks,locs,widths,proms] = findpeaks(PeakSig,x);
widths
widths = 1×6

    0.0154    0.0431    0.0377    0.0625    0.0274    0.0409
proms
proms = 1×6

    2.6816    5.5773    3.1448    4.4171    2.9191    3.6363
Sunspots are a cyclic phenomenon. Their number is known to peak roughly every 11 years.
Load the file sunspot.dat, which contains the average number of sunspots observed every year from 1700 to 1987. Find and plot the maxima.
load sunspot.dat

year = sunspot(:,1);
avSpots = sunspot(:,2);

findpeaks(avSpots,year)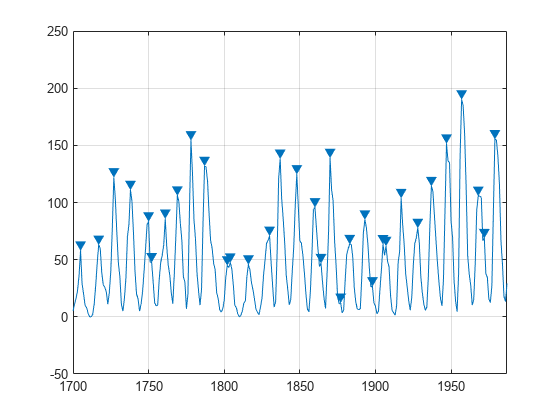
Improve your estimate of the cycle duration by ignoring peaks that are very close to each other. Find and plot the peaks again, but now restrict the acceptable peak-to-peak separations to values greater than six years.
findpeaks(avSpots,year,'MinPeakDistance',6)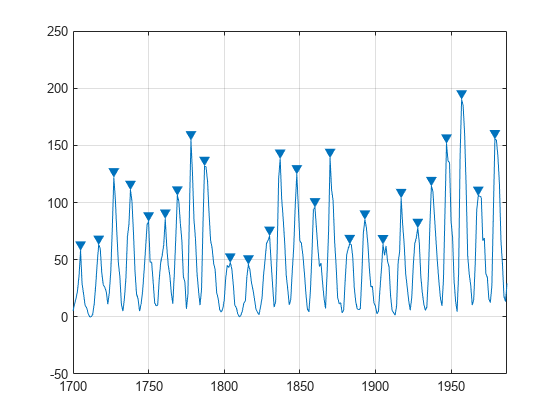
Use the peak locations returned by findpeaks to compute the mean interval between maxima.
[pks,locs] = findpeaks(avSpots,year,'MinPeakDistance',6);

meanCycle = mean(diff(locs))
meanCycle = 10.9600
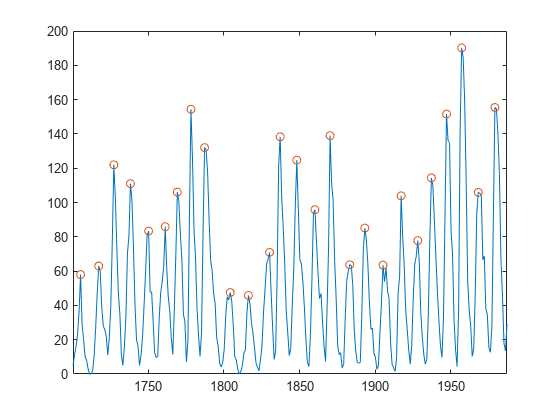
Create a datetime array using the year data. Assume the sunspots were counted every year on March 20th, close to the vernal equinox. Find the peak sunspot years. Use the years function to specify the minimum peak separation as a duration.
ty = datetime(year,3,20);

[pk,lk] = findpeaks(avSpots,ty,'MinPeakDistance',years(6));

plot(ty,avSpots,lk,pk,'o')
Compute the mean sunspot cycle using datetime functionality.
dttmCycle = years(mean(diff(lk)))
dttmCycle =
10.9600
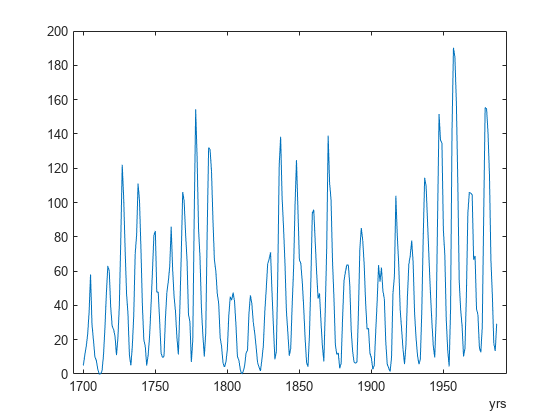
Create a timetable with the data. Specify the time variable in years. Plot the data. Show the last five entries of the timetable.
TT = timetable(years(year),avSpots);
plot(TT.Time,TT.Variables)
entries = TT(end-4:end,:)
entries=5×1 timetable
      Time      avSpots
    ________    _______

    1983 yrs     66.6
    1984 yrs     45.9
    1985 yrs     17.9
    1986 yrs     13.4
    1987 yrs     29.3
Load an audio signal sampled at 7418 Hz. Select 200 samples.
load mtlb
select = mtlb(1001:1200);
Find the peaks that are separated by at least 5 ms.
To apply this constraint, findpeaks chooses the tallest peak in the signal and eliminates all peaks within 5 ms of it. The function then repeats the procedure for the tallest remaining peak and iterates until it runs out of peaks to consider.
findpeaks(select,Fs,'MinPeakDistance',0.005)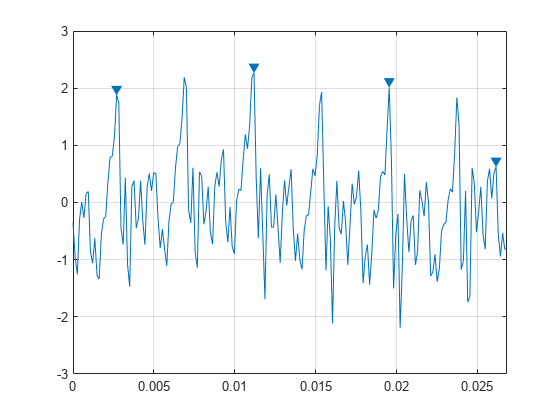
Find the peaks that have an amplitude of at least 1 V.
findpeaks(select,Fs,'MinPeakHeight',1)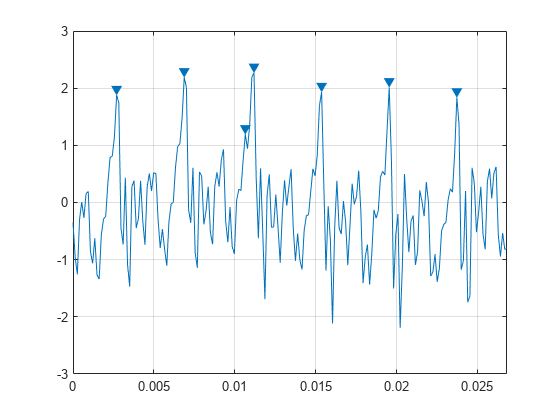
Find the peaks that are at least 1 V higher than their neighboring samples.
findpeaks(select,Fs,'Threshold',1)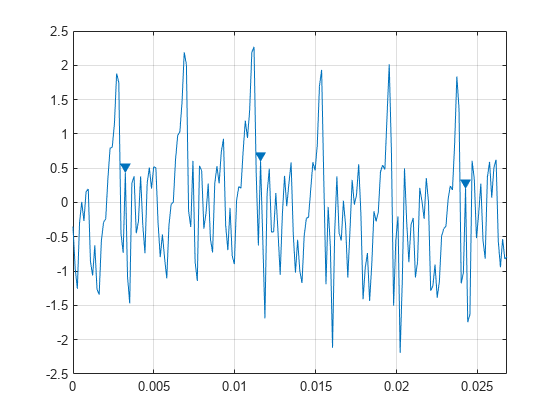
Find the peaks that drop at least 1 V on either side before the signal attains a higher value.
findpeaks(select,Fs,'MinPeakProminence',1)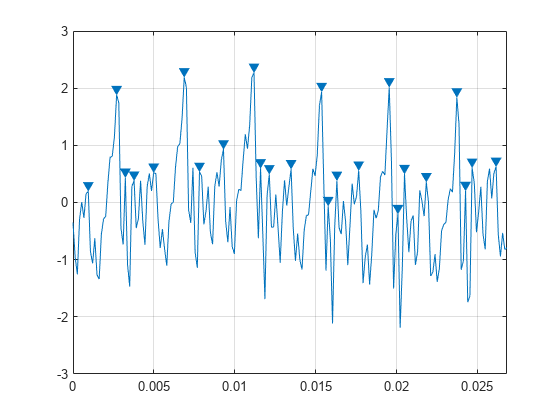
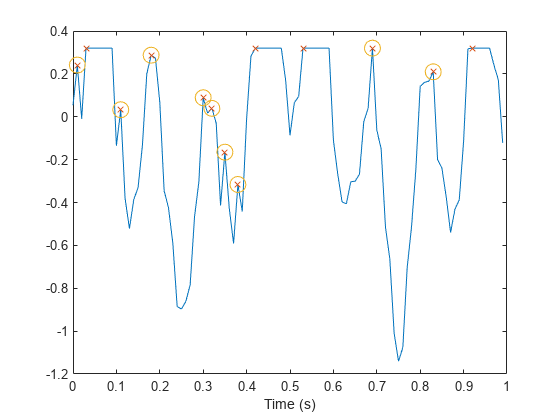
Sensors can return clipped readings if the data are larger than a given saturation point. You can choose to disregard these peaks as meaningless or incorporate them to your analysis.
Generate a signal that consists of a product of trigonometric functions of frequencies 5 Hz and 3 Hz embedded in white Gaussian noise of variance 0.1². The signal is sampled for one second at a rate of 100 Hz. Reset the random number generator for reproducible results.
rng default

fs = 1e2;
t = 0:1/fs:1-1/fs;

s = sin(2*pi*5*t).*sin(2*pi*3*t)+randn(size(t))/10;
Simulate a saturated measurement by truncating every reading that is greater than a specified bound of 0.32. Plot the saturated signal.
bnd = 0.32;
s(s>bnd) = bnd;

plot(t,s)
xlabel('Time (s)')
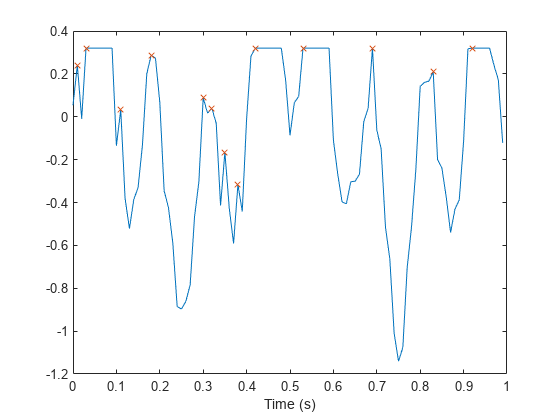
Locate the peaks of the signal. findpeaks reports only the rising edge of each flat peak.
[pk,lc] = findpeaks(s,t);

hold on
plot(lc,pk,'x')
Use the 'Threshold' name-value pair to exclude the flat peaks. Require a minimum amplitude difference of between a peak and its neighbors.
[pkt,lct] = findpeaks(s,t,'Threshold',1e-4);

plot(lct,pkt,'o','MarkerSize',12)
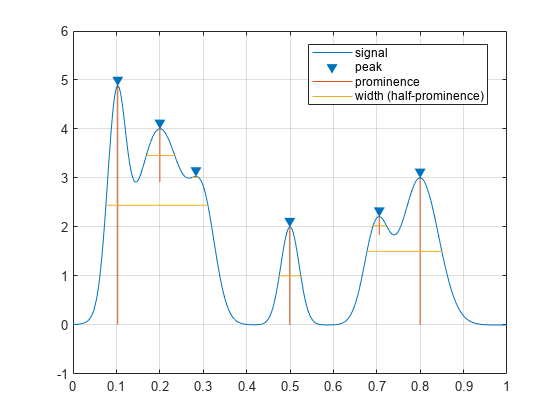
Create a signal that consists of a sum of bell curves. Specify the location, height, and width of each curve.
x = linspace(0,1,1000);

Pos = [1 2 3 5 7 8]/10;
Hgt = [4 4 2 2 2 3];
Wdt = [3 8 4 3 4 6]/100;

for n = 1:length(Pos)
    Gauss(n,:) =  Hgt(n)*exp(-((x - Pos(n))/Wdt(n)).^2);
end

PeakSig = sum(Gauss);
Plot the individual curves and their sum.
plot(x,Gauss,'--',x,PeakSig)
grid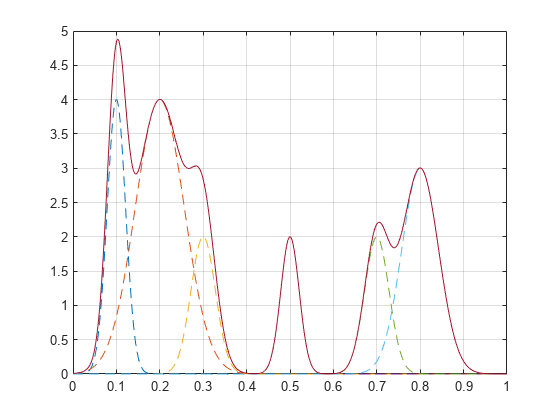
Measure the widths of the peaks using the half prominence as reference.
findpeaks(PeakSig,x,'Annotate','extents')
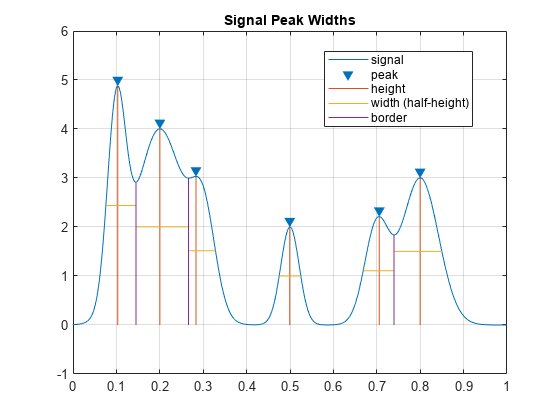
Measure the widths again, this time using the half height as reference.
findpeaks(PeakSig,x,'Annotate','extents','WidthReference','halfheight')
title('Signal Peak Widths')
Obtain a refined peak location estimate for the main two peaks in a signal using the nonlinear least squares method with a sinc function kernel.
Generate Signal
Radar pulse compression of a linear FM waveform produces a sinc-shaped spectrum, where the peaks frequency locations are proportional to the distance between the radar and the detected object. You can first estimate the peak locations and amplitudes with findpeaks and then enhance your estimates with refinepeaks. This example finds the peak amplitudes and locations of a synthetic noiseless pulse compression signal and uses refinepeaks to improve the estimates.
Generate a signal composed of two sinc-shaped waveforms with peaks of 1 and 1.5 at 4.76 kHz and 35.8 kHz, respectively. Set the frequency spacing to 2.5 Hz.
aTarget = [1 1.5];
fTarget = 1e3*[4.76 35.8];
freqkHzFull = (0:0.0025:50)';
waveFull = abs(sinc([1 0.5].*(freqkHzFull-fTarget/1e3)))*aTarget';
Downsample the signal by a factor of 200 so the frequency spacing between samples is 0.5 kHz. This example refines the amplitude and location estimates of the downsampled signal peaks and compares the improved estimates to the values in the original signals.
freq = downsample(freqkHzFull,200);
wave = downsample(waveFull,200);

plot(freqkHzFull,waveFull,freq,wave,"*")
legend(["Full signal" "Selected samples"],Location="northwest")
xlabel("Frequency (kHz)")
ylabel("Magnitude")

Refine Peaks Using Nonlinear Least Squares
Use findpeaks to make initial estimates of the amplitudes, locations, and half-height widths of the two highest peaks of the signal.
[PV,PL,PW] = findpeaks(wave,NPeaks=2, ...
    SortStr="descend",WidthReference="halfheight");
Use refinepeaks to enhance the peak estimation using the nonlinear least squares (NLS) method. Specify the frequency points of the signal and the peak widths. The peak values are significantly closer to the expected values of 1.5 and 1 while the frequency locations approximate well to 35.8 kHz and 4.76 kHz, respectively.
LW = max(PW,2);
[Ypk,Xpk] = refinepeaks(wave,PL,freq,Method="NLS",LobeWidth=LW)
Ypk = 2×1
1.5063
1.0163
Xpk = 2×1

   35.8001
    4.7628
Plot the amplitudes of the refined peaks on the y-axis and the updated peak locations compared with the initial peak estimates on the x-axis. The two initially estimated peaks and their two surrounding samples are each separated by 0.5 kHz. The refined peaks, indicated by filled circles, show the actual peak locations compared to the initially estimated peak locations as well as the corrected amplitudes.
refinepeaks(wave,PL,freq,Method="NLS",LobeWidth=LW)
yline(aTarget) % Theoretical peak amplitudes
errorBounds = aTarget.*(1+0.03*[-1;1]);
yline(errorBounds(:),":") % ±3% error bounds
legend("Peak "+[1 2])

Input Arguments
Name-Value Arguments
Output Arguments
More About
Tips
You can initially estimate signal peaks with findpeaks, and
then enhance their amplitudes and locations with refinepeaks.
Assume you have a signal with amplitudes y and locations
x. The following code snippet shows how you can estimate and
refine peaks from y and x.
[yPeaks,xPeaksIdx] = findpeaks(y);
[yRPeaks,xRPeaks] = refinepeaks(y,xPeaksIdx,x)
Extended Capabilities
Version History
Introduced in R2007bSee Also
fminbnd | fminsearch | fzero | islocalmax | islocalmin | max | refinepeaks