Classify Webcam Images Using Deep Learning
This example shows how to classify images from a webcam in real time using the pretrained deep convolutional neural network GoogLeNet.
Use MATLAB®, a simple webcam, and a deep neural network to identify objects in your surroundings. This example uses GoogLeNet, a pretrained deep convolutional neural network (CNN or ConvNet) that has been trained on over a million images and can classify images into 1000 object categories (such as keyboard, coffee mug, pencil, and many animals). You can download GoogLeNet and use MATLAB to continuously process the camera images in real time.
GoogLeNet has learned rich feature representations for a wide range of images. It takes the image as input and provides a label for the object in the image and the probabilities for each of the object categories. You can experiment with objects in your surroundings to see how accurately GoogLeNet classifies images. To learn more about the network's object classification, you can show the scores for the top five classes in real time, instead of just the final class decision.
Load Camera and Pretrained Network
Connect to the camera and load a pretrained GoogLeNet network. You can use any pretrained network at this step. The example requires MATLAB Support Package for USB Webcams, and Deep Learning Toolbox™ Model for GoogLeNet Network. If you do not have the required support packages installed, then the software provides a download link.
camera = webcam;
net = googlenet;
If you want to run the example again, first run the command clear camera where camera is the connection to the webcam. Otherwise, you see an error because you cannot create another connection to the same webcam.
Classify Snapshot from Camera
To classify an image, you must resize it to the input size of the network. Get the first two elements of the InputSize property of the image input layer of the network. The image input layer is the first layer of the network.
inputSize = net.Layers(1).InputSize(1:2)
inputSize =

   224   224
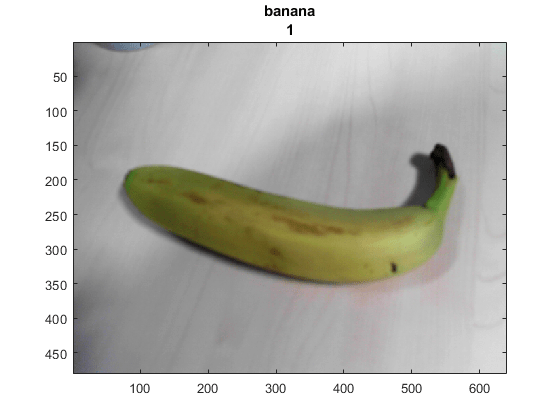
Display the image from the camera with the predicted label and its probability. You must resize the image to the input size of the network before calling classify.
figure
im = snapshot(camera);
image(im)
im = imresize(im,inputSize);
[label,score] = classify(net,im);
title({char(label),num2str(max(score),2)});
Continuously Classify Images from Camera
To classify images from the camera continuously, include the previous steps inside a loop. Run the loop while the figure is open. To stop the live prediction, simply close the figure. Use drawnow at the end of each iteration to update the figure.
h = figure;

while ishandle(h)
    im = snapshot(camera);
    image(im)
    im = imresize(im,inputSize);
    [label,score] = classify(net,im);
    title({char(label), num2str(max(score),2)});
    drawnow
end
Display Top Predictions
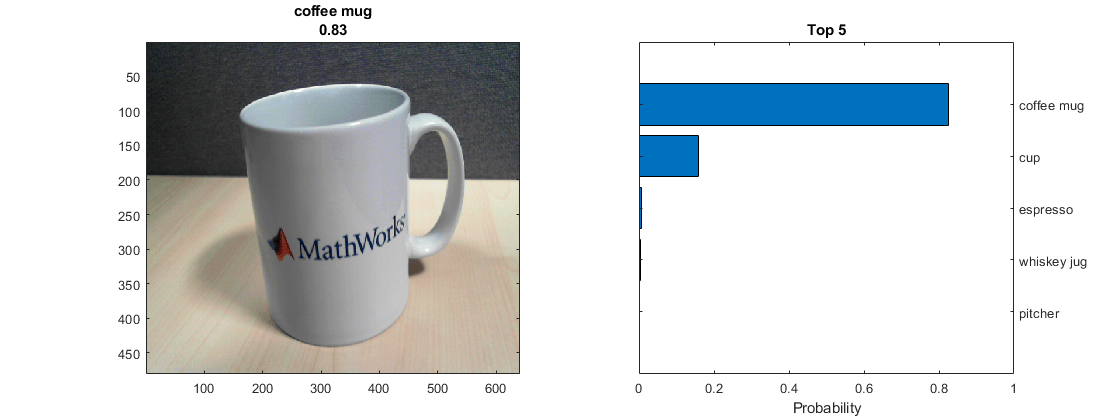
The predicted classes can change rapidly. Therefore, it can be helpful to display the top predictions together. You can display the top five predictions and their probabilities by plotting the classes with the highest prediction scores.
Classify a snapshot from the camera. Display the image from the camera with the predicted label and its probability. Display a histogram of the probabilities of the top five predictions by using the score output of the classify function.
Create the figure window. First, resize the window to have twice the width, and create two subplots.
h = figure;
h.Position(3) = 2*h.Position(3);
ax1 = subplot(1,2,1);
ax2 = subplot(1,2,2);
In the left subplot, display the image and classification together.
im = snapshot(camera);
image(ax1,im)
im = imresize(im,inputSize);
[label,score] = classify(net,im);
title(ax1,{char(label),num2str(max(score),2)});
Select the top five predictions by selecting the classes with the highest scores.
[~,idx] = sort(score,'descend');
idx = idx(5:-1:1);
classes = net.Layers(end).Classes;
classNamesTop = string(classes(idx));
scoreTop = score(idx);
Display the top five predictions as a histogram.
barh(ax2,scoreTop)
xlim(ax2,[0 1])
title(ax2,'Top 5')
xlabel(ax2,'Probability')
yticklabels(ax2,classNamesTop)
ax2.YAxisLocation = 'right';
Continuously Classify Images and Display Top Predictions
To classify images from the camera continuously and display the top predictions, include the previous steps inside a loop. Run the loop while the figure is open. To stop the live prediction, simply close the figure. Use drawnow at the end of each iteration to update the figure.
Create the figure window. First resize the window, to have twice the width, and create two subplots. To prevent the axes from resizing, set PositionConstraint property to 'innerposition'.
h = figure;
h.Position(3) = 2*h.Position(3);
ax1 = subplot(1,2,1);
ax2 = subplot(1,2,2);
ax2.PositionConstraint = 'innerposition';
Continuously display and classify images together with a histogram of the top five predictions.
while ishandle(h)
    % Display and classify the image
    im = snapshot(camera);
    image(ax1,im)
    im = imresize(im,inputSize);
    [label,score] = classify(net,im);
    title(ax1,{char(label),num2str(max(score),2)});

    % Select the top five predictions
    [~,idx] = sort(score,'descend');
    idx = idx(5:-1:1);
    scoreTop = score(idx);
    classNamesTop = string(classes(idx));

    % Plot the histogram
    barh(ax2,scoreTop)
    title(ax2,'Top 5')
    xlabel(ax2,'Probability')
    xlim(ax2,[0 1])
    yticklabels(ax2,classNamesTop)
    ax2.YAxisLocation = 'right';

    drawnow
end
See Also
imagePretrainedNetwork | dlnetwork | trainingOptions | trainnet