View Simulation Results
The Fixed-Point Tool uses the Simulation Data Inspector tool plotting capabilities that enable you to plot logged signals for graphical analysis. Using the Simulation Data Inspector to inspect and compare data after converting your floating-point model to fixed point facilitates tracking numerical error propagation.
Use the Simulation Data Inspector to:
Plot multiple signals in one or more axes
Compare a signal in different runs
Compare all logged signal data from different runs
Export signal logging results to a MAT-file
Specify tolerances for signal comparison
Create a report of the current view and data in the Simulation Data Inspector
Compare Runs
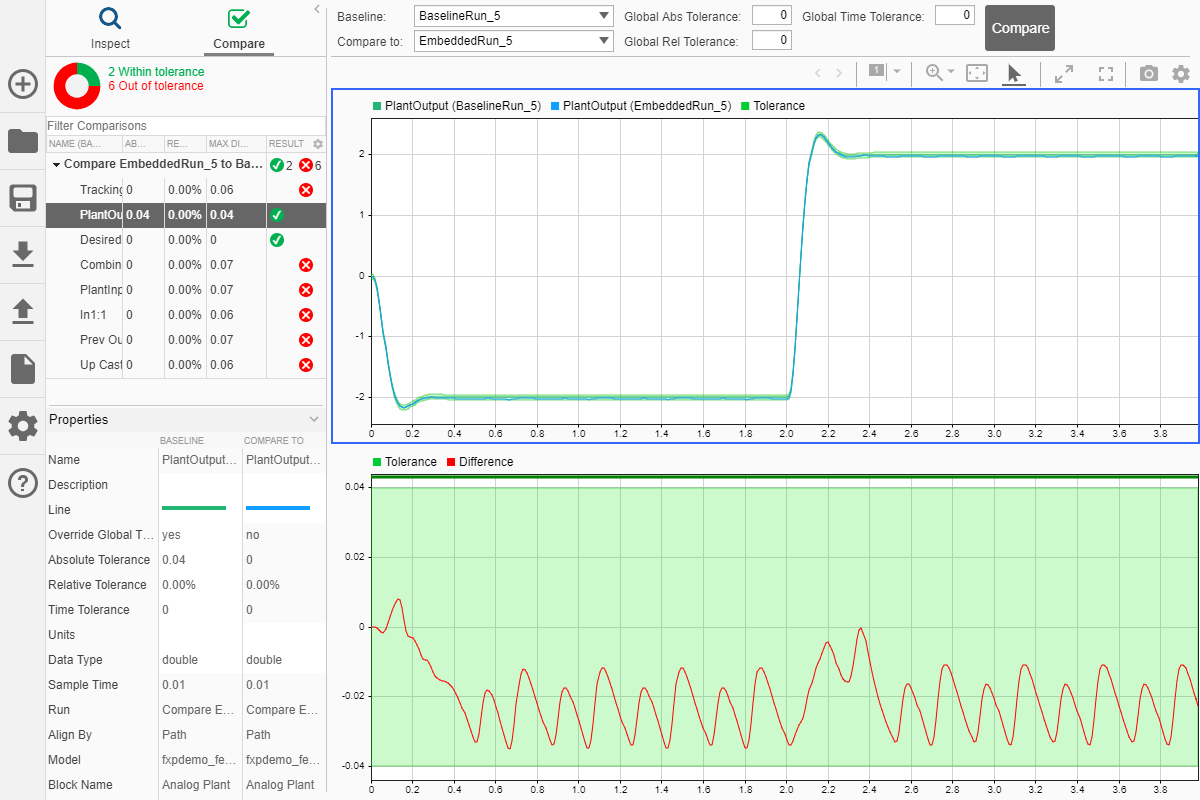
To compare runs, in the Fixed-Point Tool, right-click the embedded run and select Open Simulation Data Inspector.
On the upper axes, the Simulation Data Inspector plots the signal for the selected runs and the tolerance, if specified. On the lower axes, the Simulation Data Inspector plots the difference between those runs.
Histogram Plot of Signal
To view the histogram plot of a signal, select the signal in the Results spreadsheet. The Result Details pane includes a histogram plot that helps you visualize the dynamic range of a signal. It provides information about the:
Total number of samples (N).
Maximum number of bits to prevent overflow.
Number of times each bit has represented the data (as a percentage of the total number of samples).
Number of times that exact zero occurred (without the effect of quantization). This number does not include the number of zeros that occurred due to rounding.
You can use this information to estimate the word size required to represent the signal.
