Visualize the Basins of Attraction
R2026bWhich start points lead to which basin? For a steepest descent solver, nearby points generally lead to the same basin; see Basins of Attraction. However, for toolbox solvers, basins are more complicated.
Plot the MultiStart start points from the example Example of Run with MultiStart, color-coded with the basin where they end.
rng(14,"twister")
ms = MultiStart;
opts = optimoptions(@fmincon,Algorithm="interior-point");
sixmin = @(x)(4*x(1)^2 - 2.1*x(1)^4 + x(1)^6/3 ...
    + x(1)*x(2) - 4*x(2)^2 + 4*x(2)^4);
problem = createOptimProblem("fmincon",x0=[-1,2],...
    objective=sixmin,lb=[-3,-3],ub=[3,3],...
    options=opts);
[xminm,fminm,flagm,outptm,manyminsm] = run(ms,problem,50);
MultiStart completed the runs from all start points.

All 50 local solver runs converged with a positive local solver exitflag.
possColors = 'kbgcrm';
hold on
for i = 1:size(manyminsm,2)

    % Color of this line
    cIdx = rem(i-1, length(possColors)) + 1;
    color = possColors(cIdx);

    % Plot start points
    u = manyminsm(i).X0;
    x0ThisMin = reshape([u{:}], 2, length(u));
    plot(x0ThisMin(1, :), x0ThisMin(2, :),".", ...
        Color=color,MarkerSize=25);

    % Plot the basin with color i
    plot(manyminsm(i).X(1), manyminsm(i).X(2),"*", ...
        Color=color,MarkerSize=25);
end % Basin center marked with a *, start points with dots
hold off
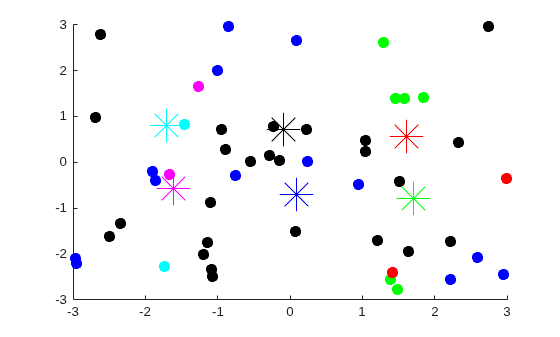
The figure shows the centers of the basins by colored * symbols. Start points with the same color as the * symbol converge to the center of the * symbol.
Start points do not always converge to the closest basin. For example, the magenta points are closer to the cyan basin center than to the red basin center. Also, many black and blue start points are closer to the opposite basin centers.
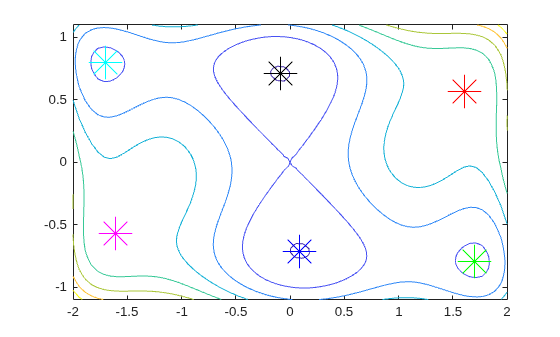
The magenta and red basins are shallow, as you can see in the following contour plot.
sixminxy = @(x,y)(4*x.^2 - 2.1*x.^4 + x.^6/3 ...
    + x.*y - 4*y.^2 + 4*y.^4);
f = @(x,y)sixminxy(x,y); % Vectorized objective fcn
fcontour(f,[-2 2 -1.1 1.1])
hold on
for i = 1:size(manyminsm,2)
    cIdx = rem(i-1, length(possColors)) + 1;
    color = possColors(cIdx);
    plot(manyminsm(i).X(1),manyminsm(i).X(2),"*",...
        Color=color,MarkerSize=25); % Plot center of basin with *
end
hold off