Design Patterns Using Advanced Chart Features
Temporal Logic
Stateflow® temporal logic operators (such as after,
before, or every) are Boolean operators that operate
on recurrence counts of Stateflow events. Temporal logic operators can appear only in conditions on transitions
that originate from states, and in state actions. Although temporal logic does not introduce
new events into a Stateflow model, it is useful to think of the change of value of a temporal logic
condition as an event. You can use temporal logic operators in many cases where a counter is
required. A common use case would be to use temporal logic to implement a time-out
counter.
For detailed information, see Control Chart Execution by Using Temporal Logic (Stateflow).
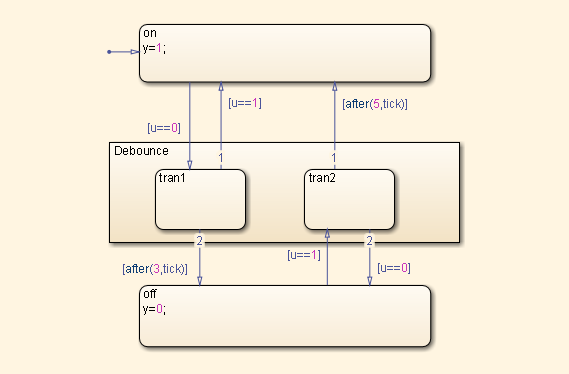
The chart shown in the following figure uses temporal logic in a design for a debouncer. Instead of instantaneously switching between on and off states, the chart uses two intermediate states and temporal logic to ignore transients. The transition is committed based on a time-out.
By default, states in a Stateflow Chart are ordered alphabetically. The ordering of states in the HDL code can potentially vary if you enable active state output port generation in the HDL code. To enable this setting, open the Chart properties and select the Create output port for monitoring check box. See also Simplify Stateflow Charts by Incorporating Active State Output (Stateflow).
When you generate VHDL® code, the recently added state is selected as the OTHERS
state in the HDL code. The following code excerpt shows VHDL code generated from this Chart.
Chart_1_output : PROCESS (is_Chart, u, temporalCounter_i1, y_reg)
    VARIABLE temporalCounter_i1_temp : unsigned(7 DOWNTO 0);
  BEGIN
    temporalCounter_i1_temp := temporalCounter_i1;
    is_Chart_next <= is_Chart;
    y_reg_next <= y_reg;
    IF temporalCounter_i1 < 7 THEN
      temporalCounter_i1_temp := temporalCounter_i1 + 1;
    END IF;

    CASE is_Chart IS
      WHEN IN_tran1 =>
        IF u = 1.0 THEN
          is_Chart_next <= IN_on;
          y_reg_next <= 1.0;
        ELSIF temporalCounter_i1_temp >= 3 THEN
          is_Chart_next <= IN_off;
          y_reg_next <= 0.0;
        END IF;
      WHEN IN_tran2 =>
        IF temporalCounter_i1_temp >= 5 THEN
          is_Chart_next <= IN_on;
          y_reg_next <= 1.0;
        ELSIF u = 0.0 THEN
          is_Chart_next <= IN_off;
          y_reg_next <= 0.0;
        END IF;
      WHEN IN_off =>
        IF u = 1.0 THEN
          is_Chart_next <= IN_tran2;
          temporalCounter_i1_temp := to_unsigned(0, 8);
        END IF;
      WHEN OTHERS =>
        IF u = 0.0 THEN
          is_Chart_next <= IN_tran1;
          temporalCounter_i1_temp := to_unsigned(0, 8);
        END IF;
    END CASE;

    temporalCounter_i1_next <= temporalCounter_i1_temp;
  END PROCESS Chart_1_output;
Graphical Function
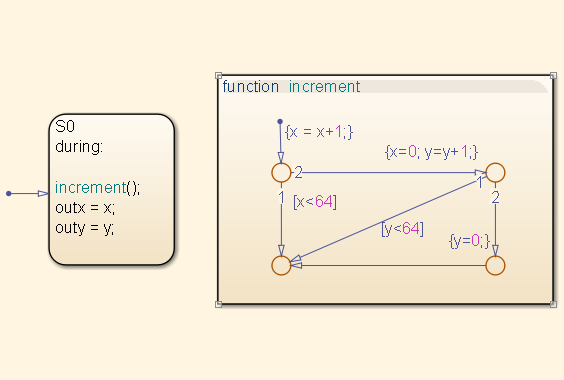
A graphical function is a function defined graphically by a flow diagram. Graphical functions reside in a chart along with the diagrams that invoke them. Like MATLAB® functions and C functions, graphical functions can accept arguments and return results. Graphical functions can be invoked in transition and state actions.
The following figure shows a graphical function that implements a 64–by–64 counter.
The following code excerpt shows VHDL code generated for this graphical function.
     x64_counter_sf : PROCESS (x, y, outx_reg, outy_reg)
        -- local variables
        VARIABLE x_temp : unsigned(7 DOWNTO 0);
        VARIABLE y_temp : unsigned(7 DOWNTO 0);
    BEGIN
        outx_reg_next <= outx_reg;
        outy_reg_next <= outy_reg;
        x_temp := x;
        y_temp := y;
        x_temp := tmw_to_unsigned(tmw_to_unsigned(tmw_to_unsigned(x_temp, 9), 10)
				+ tmw_to_unsigned(to_unsigned(1, 9), 10), 8);

        IF x_temp < to_unsigned(64, 8) THEN
            NULL;
        ELSE
            x_temp := to_unsigned(0, 8);
            y_temp := tmw_to_unsigned(tmw_to_unsigned(tmw_to_unsigned(y_temp, 9), 10)
				  + tmw_to_unsigned(to_unsigned(1, 9), 10), 8);

            IF y_temp < to_unsigned(64, 8) THEN
                NULL;
            ELSE
                y_temp := to_unsigned(0, 8);
            END IF;

        END IF;

        outx_reg_next <= x_temp;
        outy_reg_next <= y_temp;
        x_next <= x_temp;
        y_next <= y_temp;
    END PROCESS x64_counter_sf;
Hierarchy and Parallelism
Stateflow charts support both hierarchy (states containing other states) and parallelism (multiple states that can be active simultaneously).
In Stateflow semantics, parallelism is not synonymous with concurrency. Parallel states can be active simultaneously, but they are executed sequentially according to their execution order. (Execution order is displayed on the upper right corner of a parallel state).
For detailed information on hierarchy and parallelism, see Overview of Stateflow Objects (Stateflow) and Execution Order for Parallel States (Stateflow).
For HDL code generation, an entire chart maps to a single output computation process. Within the output computation process:
The execution of parallel states proceeds sequentially.
Nested hierarchical states map to nested
CASEstatements in the generated HDL code.
Stateless Charts
Charts consisting of pure flow diagrams (i.e., charts without states ) are useful in
capturing if-then-else constructs used in procedural languages like
C.
As an example, consider the following logic, expressed in C-like pseudocode.
if(U1==1) {
    if(U2==1) {
       Y = 1;
    }else{
      Y = 2;
    }
}else{
   if(U2<2) {
      Y = 3;
   }else{
      Y = 4;
	   }
      }
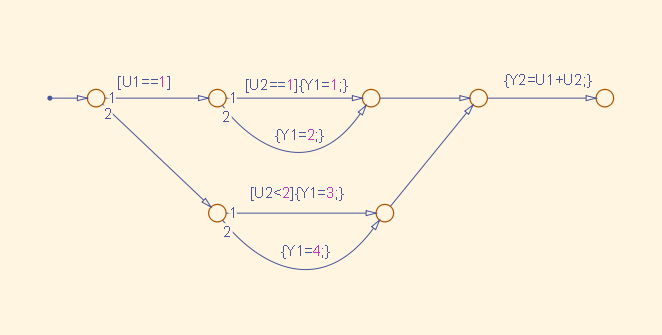
The following figure shows the flow diagram that implements the
if-then-else logic.
The following generated VHDL code excerpt shows the nested IF-ELSE statements obtained from the flow diagram.
Chart : PROCESS (Y1_reg, Y2_reg, U1, U2)
        -- local variables
    BEGIN
        Y1_reg_next <= Y1_reg;
        Y2_reg_next <= Y2_reg;

        IF unsigned(U1) = to_unsigned(1, 8) THEN

            IF unsigned(U2) = to_unsigned(1, 8) THEN
                Y1_reg_next <= to_unsigned(1, 8);
            ELSE
                Y1_reg_next <= to_unsigned(2, 8);
            END IF;

        ELSIF unsigned(U2) < to_unsigned(2, 8) THEN
            Y1_reg_next <= to_unsigned(3, 8);
        ELSE
            Y1_reg_next <= to_unsigned(4, 8);
        END IF;

        Y2_reg_next <= tmw_to_unsigned(tmw_to_unsigned(tmw_to_unsigned(unsigned(U1), 9),10)
        + tmw_to_unsigned(tmw_to_unsigned(unsigned(U2), 9), 10), 8);
    END PROCESS Chart;
Truth Tables
HDL Coder™ supports HDL code generation for:
Truth Table functions within a Stateflow chart
Truth Table (Stateflow) blocks in Simulink® models
This section examines a Truth Table function in a chart, and the VHDL code generated for the chart.
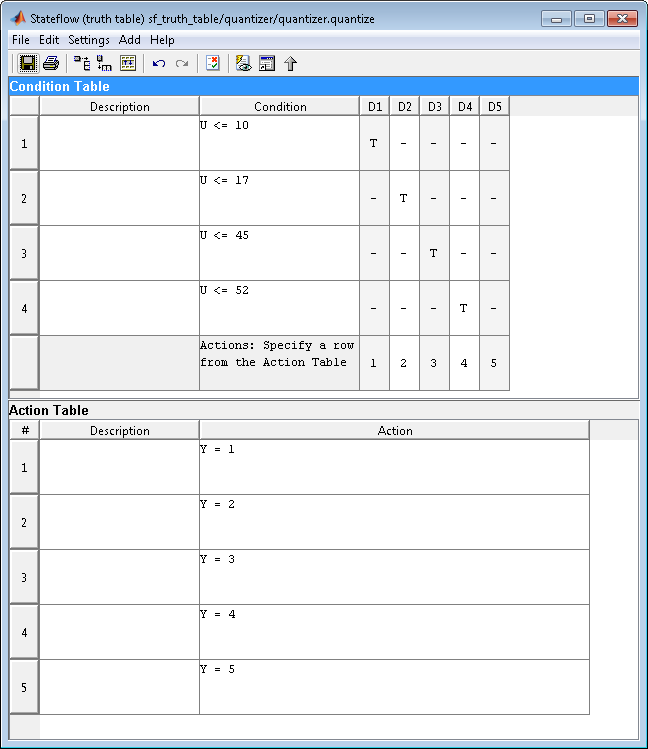
Truth Tables are well-suited for implementing compact combinatorial logic. A typical application for Truth Tables is to implement nonlinear quantization or threshold logic. Consider the following logic:
Y = 1 when 0  <= U <= 10
Y = 2 when 10 <  U <= 17
Y = 3 when 17 <  U <= 45
Y = 4 when 45 <  U <= 52
Y = 5 when 52 <  U
A stateless chart with a single call to a Truth Table function can represent this logic succinctly.
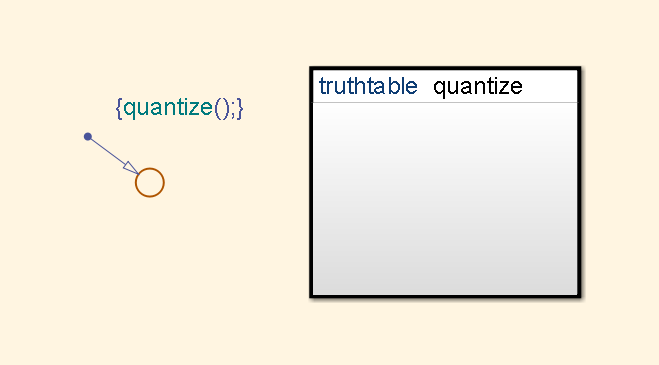
The following figure shows the quantizer chart, containing the
Truth Table.
The following figure shows the threshold logic, as displayed in the Truth Table Editor.
The following code excerpt shows VHDL code generated for the quantizer chart.
    quantizer : PROCESS (Y_reg, U)
        -- local variables
        VARIABLE aVarTruthTableCondition_1 : std_logic;
        VARIABLE aVarTruthTableCondition_2 : std_logic;
        VARIABLE aVarTruthTableCondition_3 : std_logic;
        VARIABLE aVarTruthTableCondition_4 : std_logic;
    BEGIN
        Y_reg_next <= Y_reg;
        -- Condition #1
        aVarTruthTableCondition_1 := tmw_to_stdlogic(unsigned(U) <= to_unsigned(10, 8));
        -- Condition #2
        aVarTruthTableCondition_2 := tmw_to_stdlogic(unsigned(U) <= to_unsigned(17, 8));
        -- Condition #3
        aVarTruthTableCondition_3 := tmw_to_stdlogic(unsigned(U) <= to_unsigned(45, 8));
        -- Condition #4
        aVarTruthTableCondition_4 := tmw_to_stdlogic(unsigned(U) <= to_unsigned(52, 8));

        IF tmw_to_boolean(aVarTruthTableCondition_1) THEN
            -- D1
            -- Action 1
            Y_reg_next <= to_unsigned(1, 8);
        ELSIF tmw_to_boolean(aVarTruthTableCondition_2) THEN
            -- D2
            -- Action 2
            Y_reg_next <= to_unsigned(2, 8);
        ELSIF tmw_to_boolean(aVarTruthTableCondition_3) THEN
            -- D3
            -- Action 3
            Y_reg_next <= to_unsigned(3, 8);
        ELSIF tmw_to_boolean(aVarTruthTableCondition_4) THEN
            -- D4
            -- Action 4
            Y_reg_next <= to_unsigned(4, 8);
        ELSE
            -- Default
            -- Action 5
            Y_reg_next <= to_unsigned(5, 8);
        END IF;

    END PROCESS quantizer;
Note
When generating code for a Truth Table (Stateflow) block in a Simulink model, HDL Coder writes a separate entity/architecture file for the Truth
Table code. The file is named Truth_Table.vhd (for
VHDL) , Truth_Table.v (for Verilog®) or Truth_Table.sv (for SystemVerilog).
See Also
State Transition Table (Stateflow) | Truth Table (Stateflow) | Sequence Viewer (Stateflow)