chgFreqUnit
Change frequency units of frequency-response data model
Description
sys_new =
chgFreqUnit(sys,newfrequnits)sys to
newfrequnits without modifying system behavior. Both
Frequency and FrequencyUnit properties of
sys adjust so that the frequency responses of
sys and sys_new match.
Examples
Create a frequency-response data model.
load('AnalyzerData');
sys = frd(resp,freq);
The data file AnalyzerData has column vectors freq and resp. These vectors contain 256 test frequencies and corresponding complex-valued frequency response points, respectively. The default frequency units of sys is rad/TimeUnit, where TimeUnit is the system time units.
Change the frequency units.
sys1 = chgFreqUnit(sys,'rpm');The FrequencyUnit property of sys1 is rpm.
Compare the Bode responses of sys and sys1.
bodeplot(sys,'r',sys1,'y--');
legend('sys','sys1')
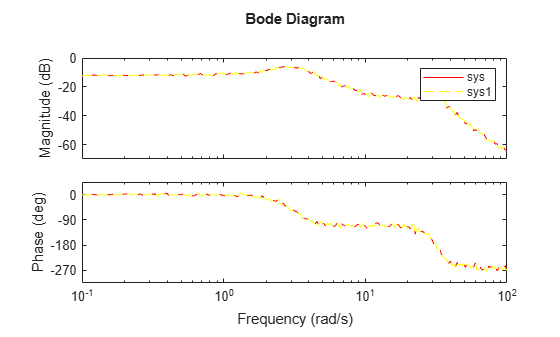
The magnitude and phase of sys and sys1 match because chgFreqUnit command changes the units of frequency points in sys without modifying system behavior.
Change the FrequencyUnit property of sys to compare the Bode response with the original system.
sys2 = sys;
sys2.FrequencyUnit = 'rpm';
bodeplot(sys,'r',sys2,'gx');
legend('sys','sys2');

Changing the FrequencyUnit property changes the system behavior. Therefore, the Bode responses of sys and sys2 do not match. For example, the original corner frequency at about 2 rad/s changes to approximately 2 rpm (or 0.2 rad/s).
Input Arguments
Output Arguments
Version History
Introduced in R2012a
See Also
chgTimeUnit | frd (Control System Toolbox) | idfrd
Topics
- Specify Frequency Units of Frequency-Response Data Model (Control System Toolbox)