displayChart
R2026bDisplay test chart with overlaid regions of interest
Description
displayChart( displays an eSFR or
ColorChecker test chart with ROIs overlaid on the detected features of the
chart.chart)
displayChart(
controls aspects of the chart display using name-value arguments.chart,Name=Value)
Examples
Read an image of an eSFR chart into the workspace.
I = imread("eSFRTestImage.jpg");Create an esfrChart object that stores information about the test chart.
chart = esfrChart(I);
Display only the color patch ROIs. To accomplish this, turn off the display of slanted edge ROIs, gray patch ROIs, and registration points.
displayChart(chart,displayEdgeROIs=false,displayGrayROIs=false, ...
    displayRegistrationPoints=false);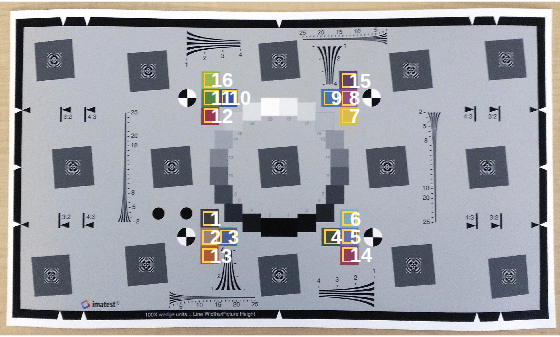
Read an image of a ColorChecker® chart into the workspace.
I = imread("colorCheckerTestImage.jpg");Create a colorChecker object by performing automatic chart detection on the image.
chart = colorChecker(I);
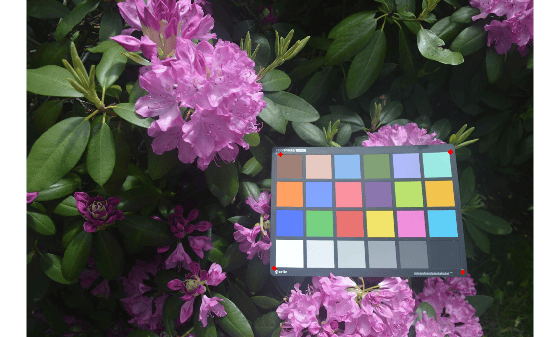
Display the chart with the detected corner registration points only. Turn off the display of the color patch ROIs.
displayChart(chart,DisplayColorROIs=false)
Input Arguments
Name-Value Arguments
References
[1] Imatest. "Esfr". https://www.imatest.com/mathworks/esfr/.
[2] Calibrite. "ColorChecker Classic". https://calibrite.com/us/product/colorchecker-classic/.

