Display Data over Basemaps When Internet Access Is Intermittent
In most cases, displaying data over basemaps requires internet access. When you have intermittent internet access, you can prepare for an offline workflow by reading an image from a basemap and saving the image as a MAT or GeoTIFF file. Then, when you are in an offline environment, you can load the image from the file and use it as a base layer for your data.
This example shows how to plot point data over a basemap image. The behavior of the example depends on whether you have internet access, but the resulting map is the same.
Specify whether you have internet access by using the logical scalar useInternet.
If
useInternetistrue, read an image from the basemap and save it to a GeoTIFF file.If
useInternetisfalse, read an image from a GeoTIFF file.
useInternet = true;
If you use this example as a model to create your own maps, you must create the saved files the first time you run the example by setting useInternet to true.
Load Data
Import a shapefile containing the coordinates of locations in Boston as a geospatial table. The shapefile represents the locations using points in a projected coordinate reference system (CRS). Extract the xy-coordinates.
GT = readgeotable("boston_placenames.shp");
pointsX = GT.Shape.X;
pointsY = GT.Shape.Y;
Get information about the projected CRS.
pointsCRS = GT.Shape.ProjectedCRS
pointsCRS =
  projcrs with properties:

                    Name: "NAD83 / Massachusetts Mainland"
           GeographicCRS: [1×1 geocrs]
        ProjectionMethod: "Lambert Conic Conformal (2SP)"
              LengthUnit: "meter"
    ProjectionParameters: [1×1 map.crs.ProjectionParameters]
Read Basemap
When you read an image from a basemap using the readBasemapImage function, you must specify the region to read using latitude and longitude coordinates. For this example, however, the locations are in projected coordinates. Unproject the xy-coordinates to latitude and longitude coordinates.
[pointslat,pointslon] = projinv(pointsCRS,pointsX,pointsY);
Create a quadrangular area of interest (AOI) from the latitude and longitude coordinates. Buffer the AOI by 0.005 degrees. Then, find the latitude and longitude limits of the buffered AOI.
aoi = aoiquad(pointslat,pointslon);
aoi = buffer(aoi,0.005);
[latlim,lonlim] = bounds(aoi);
Read a basemap image for the region from the "satellite" basemap.
If
useInternetistrue, read the basemap image as an array, a map cells reference object in Web Mercator coordinates (EPSG code3857), and an attribution string. Save the array and reference object to a GeoTIFF file. Include the attribution by specifying theImageDescriptionTIFF tag.If
useInternetisfalse, load the basemap image and attribution.
if useInternet
    [A,R,attrib] = readBasemapImage("satellite",latlim,lonlim);
    tag = struct("ImageDescription",attrib);
    geotiffwrite("satelliteBoston.tif",A,R,CoordRefSysCode=3857,TiffTags=tag)
else
    [A,R] = readgeoraster("satelliteBoston.tif");
    info = imfinfo("satelliteBoston.tif");
    attrib = info.ImageDescription;
end
Project Data to Web Mercator Coordinates
Project the geographic coordinates to the same CRS as the basemap image.
[wmX,wmY] = projfwd(R.ProjectedCRS,pointslat,pointslon);
Display Data over Basemap Image
Display the basemap image on a map with no axis labels.
figure
mapshow(A,R)
hold on
axis off
Display the locations on the same map.
mapshow(wmX,wmY,DisplayType="point",Marker="o",MarkerFaceColor="r")
title("Locations in Boston Over Satellite Imagery")
subtitle("Basemap Attribution: " + attrib)
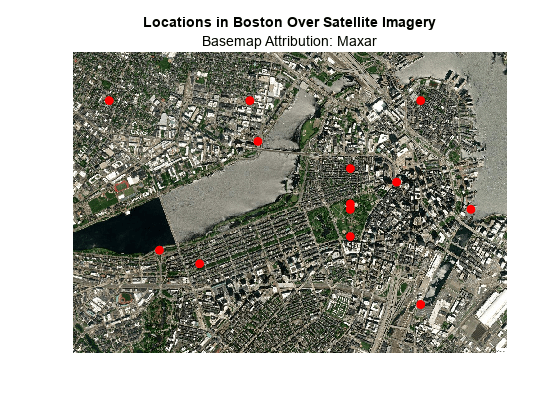
The geographic CRS underlying the geographic coordinates is NAD83, while the geographic CRS underlying the basemap image is WGS84. NAD83 and WGS84 are similar, but not identical. As a result, the coordinates and basemap can appear misaligned.