clabelm
Label map contour plot
Syntax
Description
Rotated Labels
clabelm( labels the
current map contour plot by inserting rotated text into each contour line. If a contour
line is not long enough to fit the text, then the function does not insert the
text.C,h)
The clabelm function supports only contour plots created using
the contourfm, contourm, contour3m, or geoshow function. To label other contour plots, use the clabel function.
t = clabelm(___)t to modify properties of the text after
creating it. For a list of properties, see Text Properties.
Upright Labels
clabelm( labels the current contour plot
by adding upright text next to each contour line. The function randomly selects the
positions of the labels. This syntax displays plus symbols (C)+) on the
contour lines next to the labels.
clabelm( labels the locations you
select with the mouse. Click the mouse or press the space bar to label the contour closest
to the center of the cursor. To finish labeling, while the cursor is within the figure,
press Enter.C,"manual")
tl = clabelm(___)+) as line objects, using
any combination of input arguments from the previous syntaxes in this group.
Additional Options
clabelm(___,"LabelSpacing",
specifies the spacing between labels on the same contour line.spacing)
Examples
Create a contour plot from sample map data. Obtain the contour matrix C and the contour patch h. Then, label the contour plot.
Z = peaks;
R = georefcells([-0.1 0],[0 0.1],size(Z));
axesm miller
[C,h] = contourm(Z,R);

clabelm(C,h)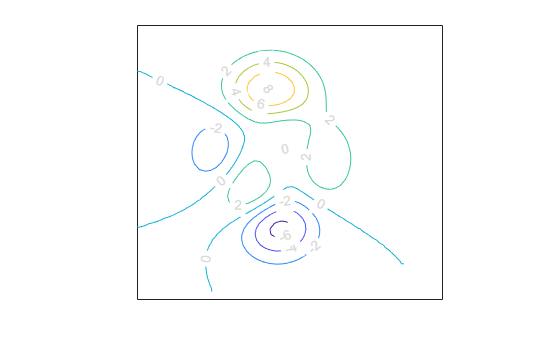
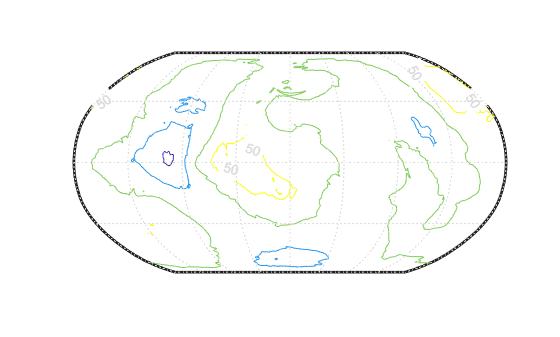
Create a contour plot using geoid heights from the Earth Gravitational Model of 1996 (EGM96). Label only the contours with contour levels -100 or 50.
[N,R] = egm96geoid;
worldmap(N,R)
plabel off
mlabel off

[C,h] = contourm(N,R,-100:50:100);
clabelm(C,h,[-100 50])
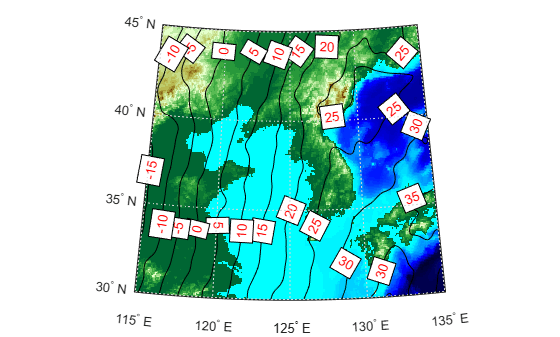
Create an elevation map for a region surrounding the Korean peninsula.
load korea5c
worldmap(korea5c,korea5cR)
geoshow(korea5c,korea5cR,"DisplayType","texturemap")
demcmap(korea5c)
Create a contour plot using geoid heights from the Earth Gravitational Model of 1996 (EGM96).
N = egm96geoid(korea5cR);
[C,h] = contourm(N,korea5cR,-100:5:100,"k");
Label the contours and return the text objects. Change the text color and the edge color by setting properties of the text objects.
t = clabelm(C,h);
set(t,"Color","r")
set(t,"EdgeColor","k")
Input Arguments
Output Arguments
Version History
Introduced before R2006a