zscale
Description
zscale( sets the scale of the
z-axis to be linear or logarithmic in the current axes. Specify
scale)scale as "linear" or "log". You
can also omit the parentheses and quotation marks when using this syntax. For example,
zscale log is equivalent to zscale("log").
zs = zscale returns the current z-axis scale
value as 'linear' or 'log'.
Examples
Create matrices X, Y, and Z, and use them to create a surface plot.
[X,Y] = meshgrid(0:1:100);
Z = X.*Y;
surf(X,Y,Z,EdgeColor="none")
view(-145,10)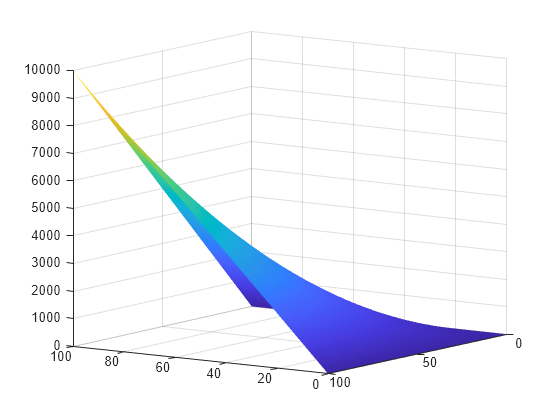
Change the scale of the z-axis to logarithmic.
zscale log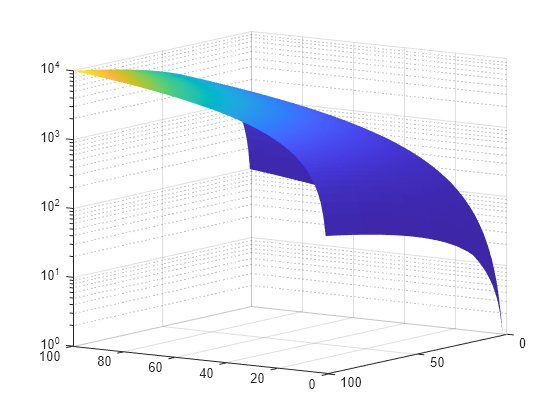
Create the same surface plot twice in a tiled chart layout. This code calls the nexttile function to create a tiled chart layout with one axes object. The second call to nexttile creates and returns the second axes object.
[X,Y] = meshgrid(0:1:100);
Z = X.*Y;

nexttile;
surf(X,Y,Z,EdgeColor="none")
view(-145,10)
title("Linear Scale")

ax2 = nexttile;
surf(X,Y,Z,EdgeColor="none")
view(-145,10)
title("Log Scale")
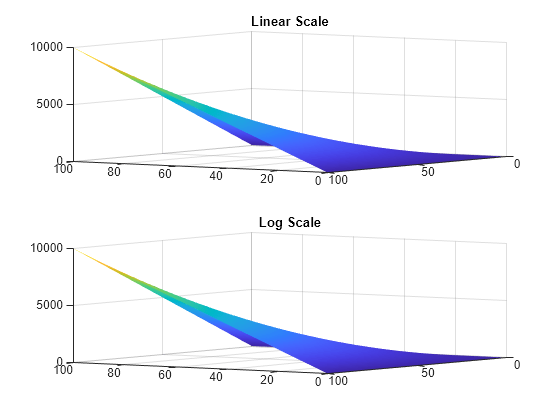
Change the z-axis scale of the bottom plot to logarithmic.
zscale(ax2,"log")
Input Arguments
Version History
Introduced in R2023b