Main Content

ztickangle

Rotate z-axis tick labels

Description

example

ztickangle(angle) rotates the z-axis tick labels for the current axes to the specified angle in degrees, where 0 is horizontal. Specify a positive value for counterclockwise rotation or a negative value for clockwise rotation.

example

ztickangle(ax,angle) rotates the tick labels for the axes specified by ax instead of the current axes.

example

ang = ztickangle returns the rotation angle for the z-axis tick labels of the current axes as a scalar value in degrees. Positive values indicate counterclockwise rotation. Negative values indicate clockwise rotation.

ang = ztickangle(ax) uses the axes specified by ax instead of the current axes.

Examples

collapse all

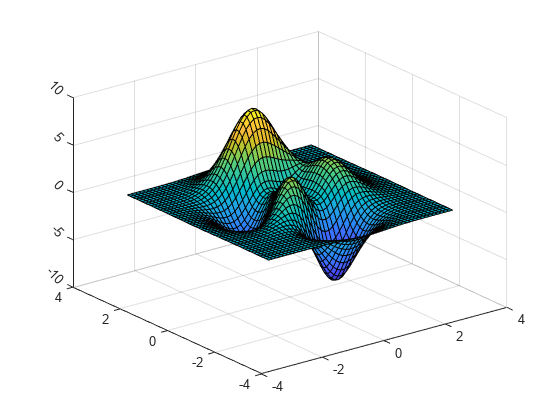
Create a surface chart and rotate the z-axis tick labels 45 degrees clockwise.

[x,y,z] = peaks;
surf(x,y,z)
ztickangle(-45)

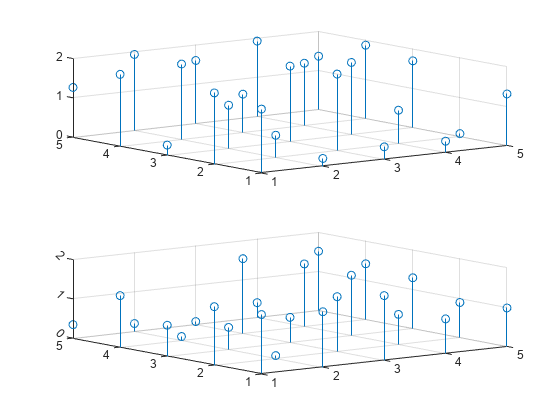
Starting in R2019b, you can display a tiling of plots using the tiledlayout and nexttile functions. Call the tiledlayout function to create a 2-by-1 tiled chart layout. Call the nexttile function to create the axes objects ax1 and ax2. Plot into each of the axes. Then rotate the z-axis tick labels for the lower plot by specifying ax2 as the first input argument to ztickangle.

tiledlayout(2,1)
ax1 = nexttile;
stem3(ax1,2*rand(5))

ax2 = nexttile;
stem3(ax2,2*rand(5))
ztickangle(ax2,-45)

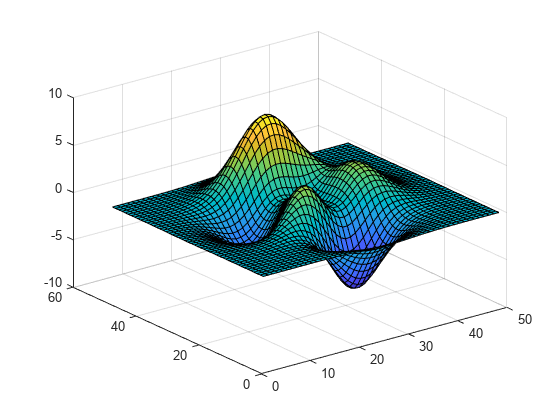
Create a surface chart. Then, query the rotation angle for the z-axis tick labels. By default, the labels are not rotated.

[x,y,z] = peaks;
surf(peaks)

ang = ztickangle
ang = 0

Input Arguments

collapse all

Rotation of tick labels, specified as a scalar value in degrees, where 0 is horizontal.

Example: ztickangle(90)

Target axes, specified as an Axes object or an array of Axes objects.

If you do not specify this argument, then ztickangle modifies the current axes.

Algorithms

The ztickangle function sets and queries the ZTickLabelRotation property of the Axes object.

Version History

Introduced in R2016b