Remove Risk Factors
This example shows how to remove or include variables from a table and record the corresponding reasons using the Modelscape™ Remove Risk Factors task.
The example also shows how to include the results of this analysis in model documents using the Modelscape reporting feature.
Not all the data in a table is necessarily usable for developing a statistical model. For example, randomized user identifiers (IDs) are often irrelevant, data protection prevents use of sensitive personal data, and some data can be of poor quality. This example shows how to select relevant variables in such a table and record your reasons.
This example uses the Credit Scorecard data set, which contains three tables of customer information such as age, income, and employment status. One such table, dataMissing, deliberately has blank entries to show how how to handle blank data. You can use the data for developing a statistical model such as a MATLAB® credit scorecard model. The example loads the data set in the Remove Risk Factors task, marks some variables for exclusion, and documents the results using Modelscape reporting.
Load Data and Launch Tool
Load the input data from the CreditCardData file.
load CreditCardData
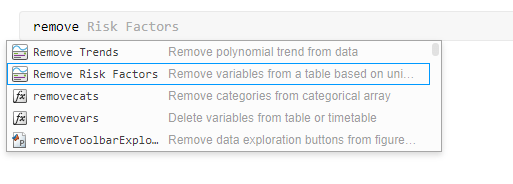
Open a new live script. Open the Remove Risk Factors task by typing remove and selecting Remove Risk Factors from the dropdown selection.

Alternatively, you can search for the tool under Task in the Live Editor gallery.
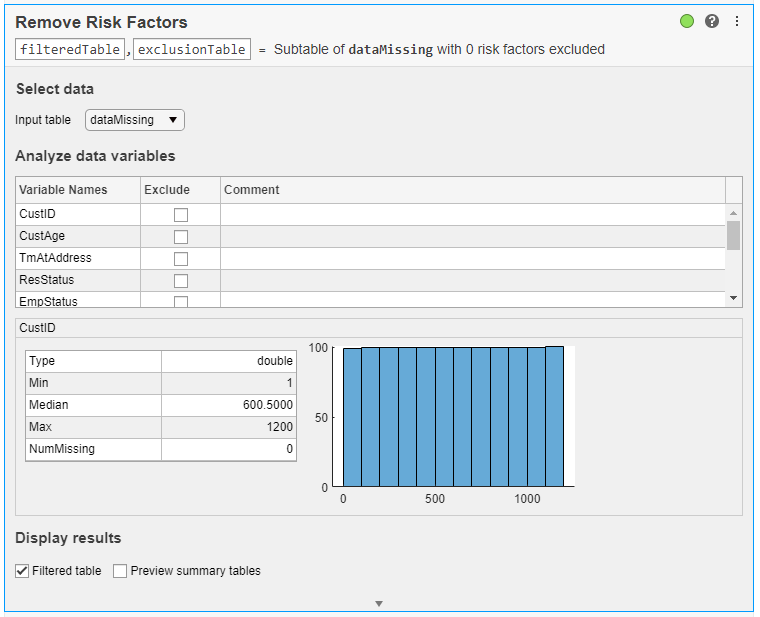
In the Select data section of the task, select the dataMissing variable.

Inspect and Filter Variables
The task shows the summary statistics and the histogram for the CustID variable.
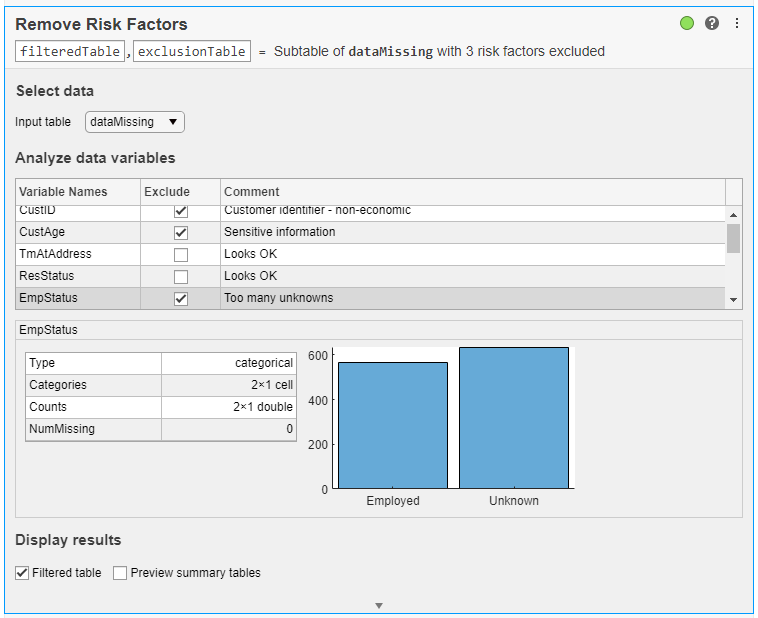
To inspect other variables, click the corresponding variable name in the Analyze data variables section. This section contains three columns that you can sort. The Variable Names column is read-only. You can use the Exclude column to exclude variables from the table. Check the Exclude button to mark the corresponding variable for removal. Use the Comment column to add reasons for the exclusion (or inclusion) by double-clicking the box.
When you exclude variables and add comments, the task dynamically produces these outputs:
filteredTable— Subtable of the input table without the excluded risk factors. Use this subtable in the next step of the model development process, for example, feature selection.exclusionTable— Table that includes all the data of the input table together with the exclusion flags and comments in the task. To view this information, check the Preview summary tables box in the Display results section. The software stores this information in theexclusionTable.Properties.CustomPropertiesvariable.
When you check the Preview summary tables box, the task displays the exclusionSummaryPreview and progressSummaryPreview tables. exclusionSummaryPreview lists all the variables with exclusion flags and comments. progressSummaryPreview lists the total number of variables, excluded variables, included variables, and variables with comments. You can use this last datum to check whether the removal process is complete. Every variable must have a reason for exclusion or an indication that you have inspected the variable.


Document with Modelscape Reporting
Use Modelscape Reporting to document the findings of your analysis using the metadata in exclusionTable. Save the summarized exclusion and progress preview tables with the names ExclusionSummary and ProgressSummary, respectively using the summarizeExclusionTable function.
import mrm.data.filter.*
[ExclusionSummary,ProgressSummary] = summarizeExclusionTable(exclusionTable)
In a Word document, create holes titled ExclusionSummary and ProgressSummary.
To create a hole in Word, make the Developer tab visible. Click File > Options, and then click Customize Ribbon. Under Main Tabs, click the Developer check box. If you do not see the Developer check box in the list, set Customize the Ribbon to Main Tabs.
On the Developer tab, click the 'Rich Text Content Control' symbol Aa in the Controls area. Then click Properties and fill in the Title and Tag fields. Set the title to ExclusionsSummary and the tag to hole.
Then create another hole, and set the title to ProgressSummary.
To insert these variables into the model document, run fillReportFromWorkspace in the MATLAB Command Window.
For more information about fillReportFromWorkspace, see Model Documentation in Modelscape.