plot
Display laser or lidar scan readings
Description
plot( plots the laser scan
readings specified in the input scanMsg)LaserScan object message. Axes are automatically scaled to the maximum
range that the laser scanner supports.
Note
plot will be removed. Use rosPlot instead. For more
information, see ROS Message Structure Functions
plot(___,Name,Value) provides additional options
specified by one or more Name,Value pair arguments.
linehandle = plot(___)linehandle to modify properties of the
line series after it is created.
When plotting ROS laser scan messages, MATLAB® follows the standard ROS convention for axis orientation. This convention states that positive x is forward, positive y is left, and positive z is up. For more information, see Axis Orientation on the ROS Wiki.
Examples
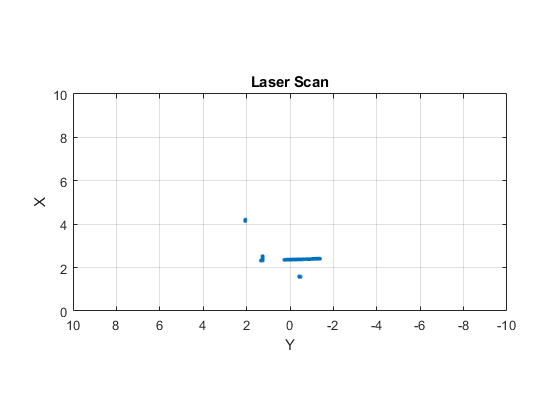
Connect to ROS network. Subscribe to a laser scan topic, and receive a message.
rosinit('192.168.17.129')Initializing global node /matlab_global_node_90279 with NodeURI http://192.168.17.1:50889/
sub = rossubscriber('/scan');
scan = receive(sub);
Plot the laser scan.
plot(scan)
Shutdown ROS network.
rosshutdown
Shutting down global node /matlab_global_node_90279 with NodeURI http://192.168.17.1:50889/
Connect to ROS network. Subscribe to a laser scan topic, and receive a message.
rosinit('192.168.17.129')Initializing global node /matlab_global_node_31712 with NodeURI http://192.168.17.1:51463/
sub = rossubscriber('/scan');
scan = receive(sub);
Plot the laser scan specifying the maximum range.
plot(scan,'MaximumRange',6)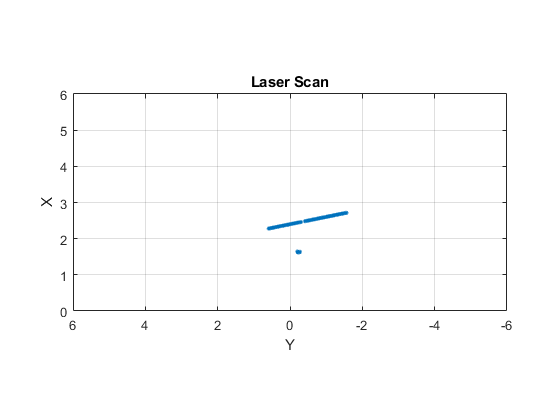
Shutdown ROS network.
rosshutdown
Shutting down global node /matlab_global_node_31712 with NodeURI http://192.168.17.1:51463/
Specify lidar data as vectors of ranges and angles. These values include readings outside of the sensor range.
x = linspace(-2,2);
ranges = abs((1.5).*x.^2 + 5);
ranges(45:55) = 3.5;
angles = linspace(-pi/2,pi/2,numel(ranges));
Create a lidar scan by specifying the ranges and angles. Plot all points of the lidar scan.
scan = lidarScan(ranges,angles);
plot(scan)
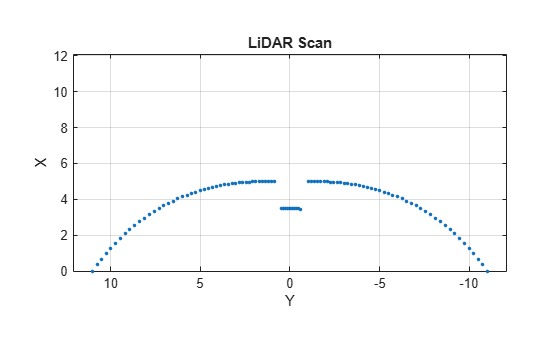
Remove invalid points based on a specified minimum and maximum range.
minRange = 0.1;
maxRange = 7;
scan2 = removeInvalidData(scan,'RangeLimits',[minRange maxRange]);
hold on
plot(scan2)
legend('All Points','Valid Points')
