Use Simulink Report Explorer Components in Report API Reports
The RptFile reporter lets you use Simulink® Report Explorer components in a Report API-based report program. This
reporter is useful if your report program needs to generate content for which a Report
Explorer component exists but for which no Report API reporter is available. For example,
the Report Explorer includes a component named Block Type Count that generates the number
of each type of block that a model contains. No equivalent Report API reporter
exists.
This example shows how to use the RptFile reporter to include a count of
the types of blocks used in the f14
Simulink model. This information is obtained from the Report Explorer Block Type Count
component and is presented in tables in the generated Report API report.
Create Report Explorer Setup Files
Create a Report Explorer setup file that includes a Block Type Count component. For information about creating a report setup file, see Report Setup.
Type
reportto open the Report Explorer.In the panel on the right, click Create and edit a Report file. Save the file as
mysetupfile.rpt.From the Simulink folder in the middle panel, add a Model Loop component to your report. Set the Model name to
Current block diagram.From the Simulink folder in the middle panel, add a System Loop component as a child of the Model Loop. Set these options:
Loop on Systems —
Select systems
                              automatically
Include subsystems in Simulink functions — selected
Sort Systems —
By system
                              depth
From the Simulink folder in the middle panel, add a Block Type Count component as a child of the System Loop. Set these options:
Table title — Block Type Count
Show block names in title — selected
Sort table —
Alphabetically by block
                              type
Save the file.
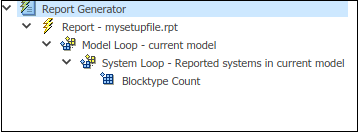
The mysetupfile.rpt hierarchy is
Create Report Generator Programs
These steps describe how to create a Report Generator program that includes a
RptFile reporter for the mysetupfile.rpt Report
Explorer setup file.
Note
The full program is listed after the steps.
To eliminate the need to use fully-qualified names of the report, finder, and utility functions, import the API functions. For example, instead of using
mlreportgen.report.TitlePage, you can useTitlePage.import slreportgen.report.* import slreportgen.finder.* import mlreportgen.report.* import mlreportgen.utils.*
Load the
f14model.model = "f14"; openExample(model);Create a report object to hold the contents of the report. Use a Simulink report constructor (
slreportgen.report.Report) to create a report object You must fully qualify the name of the constructor to distinguish it from the MATLAB® report constructor (mlreportgen.report.Report). Specify the name of the report as"My Report"and the output type as PDF.rpt = slreportgen.report.Report("MyReport","pdf");
Add a title page and table of contents to the report.
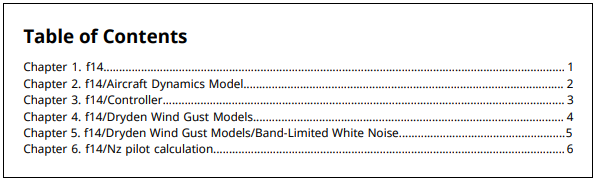
titlepg = TitlePage(); titlepg.Title = "f14 Model Block Types "; titlepg.Author = "MathWorks"; add(rpt,titlepg); toc = TableOfContents; add(rpt,toc);
Find all systems in the model.
sysdiag_finder = SystemDiagramFinder(model); found_diags = find(sysdiag_finder);
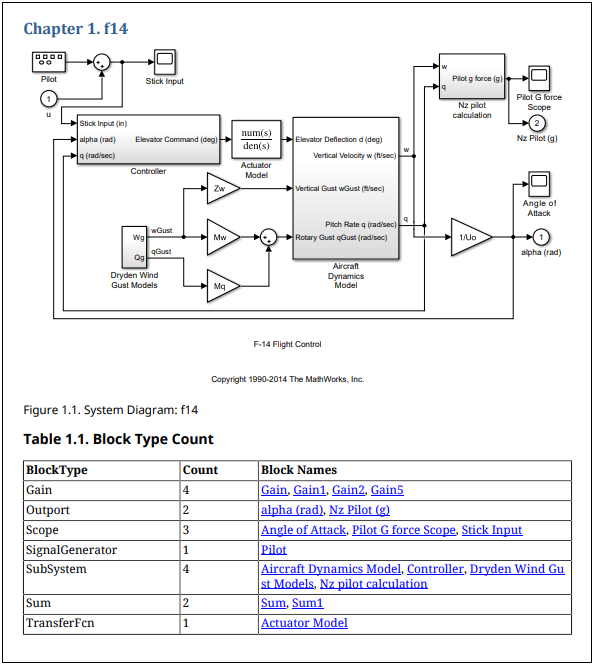
Use a for loop to create a separate chapter for each system and include a system snapshot with a single-line caption.
Create a
RptFilereporter based onmysetupfile.rpt. The reporter generates a table of block type counts for the current system. Add theRptFilereporter to the chapter and add the chapter to the report.for sysdiag = found_diags chap = Chapter(sysdiag.Path); snapshot = Diagram(sysdiag.Path); oneline = makeSingleLineText(sysdiag.Name); snapshot.Snapshot.Caption = strcat... ("System Diagram: ",oneline); add(chap,snapshot); rptFile = RptFile("mysetupfile.rpt"); rptFile.Model = model; rptFile.System = sysdiag.Path; add(chap,rptFile); add(rpt,chap); end
The first time this loop runs during report generation, a snapshot and block count of the top-level system of the model is added to the report.
Close and view the report.
close(rpt); rptview(rpt);
The full program is
import slreportgen.report.* import slreportgen.finder.* import mlreportgen.report.* import mlreportgen.utils.* model = "f14"; openExample(model); rpt = slreportgen.report.Report("MyReport","pdf"); titlepg = TitlePage(); titlepg.Title = "f14 Model Block Types "; titlepg.Author = "MathWorks"; add(rpt,titlepg); toc = TableOfContents; add(rpt,toc); sysdiag_finder = SystemDiagramFinder(model); found_diags = find(sysdiag_finder); for sysdiag = found_diags chap = Chapter(sysdiag.Path); snapshot = Diagram(sysdiag.Path); oneline = makeSingleLineText(sysdiag.Name); snapshot.Snapshot.Caption = strcat... ("System Diagram: ",oneline); add(chap,snapshot); rptFile = RptFile("mysetupfile.rpt"); rptFile.Model = model; rptFile.System = sysdiag.Path; add(chap,rptFile); add(rpt,chap); end close(rpt); rptview(rpt);