Align Two Simple Signals
This example shows how to use cross-correlation to align signals. In the most general case, the signals have different lengths, and to synchronize them properly, you must take into account the lengths and the order in which you input the arguments to xcorr.
Consider two signals, identical except for the number of surrounding zeros and for the fact that one of them lags the other.
sz = 30;
sg = randn(1,randi(8)+3);
s1 = [zeros(1,randi(sz)-1) sg zeros(1,randi(sz)-1)];
s2 = [zeros(1,randi(sz)-1) sg zeros(1,randi(sz)-1)];

mx = max(numel(s1),numel(s2));

subplot(2,1,1)
stem(s1)
xlim([0 mx+1])

subplot(2,1,2)
stem(s2,'*')
xlim([0 mx+1])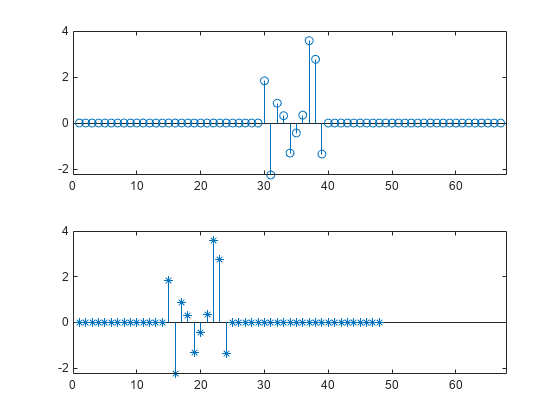
Determine which of the two signals is longer than the other in the sense of having more elements, be they zeros or not.
if numel(s1) > numel(s2)
    slong = s1;
    sshort = s2;
else
    slong = s2;
    sshort = s1;
end
Compute the cross-correlation of the two signals. Run xcorr with the longer signal as first argument and the shorter signal as second argument. Plot the result.
[acor,lag] = xcorr(slong,sshort);

[acormax,I] = max(abs(acor));
lagDiff = lag(I)
lagDiff =
15
figure
stem(lag,acor)
hold on
plot(lagDiff,acormax,'*')
hold off

Align the signals. Think of the lagging signal as being "longer" than the other, in the sense that you have to "wait longer" to detect it.
If
lagDiffis positive, "shorten" the long signal by considering its elements fromlagDiff+1 to the end.If
lagDiffis negative, "lengthen" the short signal by considering its elements from-lagDiff+1 to the end.
You must add 1 to the lag difference because MATLAB® uses one-based indexing.
if lagDiff > 0
    sorig = sshort;
    salign = slong(lagDiff+1:end);
else
    sorig = slong;
    salign = sshort(-lagDiff+1:end);
end
Plot the aligned signals.
subplot(2,1,1)
stem(sorig)
xlim([0 mx+1])

subplot(2,1,2)
stem(salign,'*')
xlim([0 mx+1])
The method works because the cross-correlation operation is antisymmetric and because xcorr deals with signals of different lengths by adding zeros at the end of the shorter signal. This interpretation lets you align the signals easily using the MATLAB® end operator without having to pad them by hand.
You can also align the signals at one stroke by invoking the alignsignals function.
[x1,x2] = alignsignals(s1,s2);

subplot(2,1,1)
stem(x1)
xlim([0 mx+1])

subplot(2,1,2)
stem(x2,'*')
xlim([0 mx+1])