Cross-Correlation of Delayed Signal in Noise
R2026bThis example shows how to use the cross-correlation sequence to detect the time delay in a noise-corrupted sequence. The output sequence is a delayed version of the input sequence with additive white Gaussian noise. Create two sequences. One sequence is a delayed version of the other. The delay is 3 samples. Add white noise to the delayed signal. Use the sample cross-correlation sequence to detect the lag.
Create and plot the signals.
rng(1,"twister")
x = triang(20);
y = [zeros(3,1);x] + 0.05*randn(length(x)+3,1);

tiledlayout("flow")
nexttile
stem(x,"filled")
axis([0 22 -1 2])
title("Input Sequence")
nexttile
stem(y,"filled")
axis([0 22 -1 2])
title("Output Sequence")
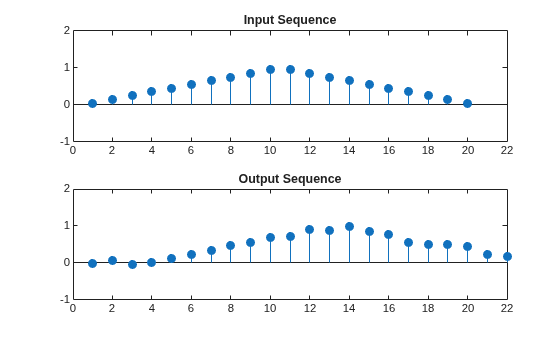
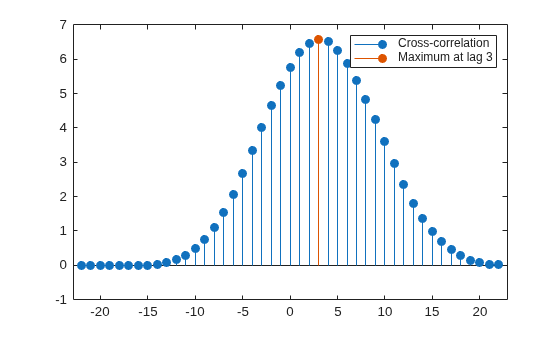
Obtain the sample cross-correlation sequence and use the maximum absolute value to estimate the lag. Plot the sample cross-correlation sequence. The maximum cross correlation sequence value occurs at lag 3, as expected.
[xc,lags] = xcorr(y,x);
[~,I] = max(abs(xc));

figure
stem(lags,xc,"filled")
hold on
stem(lags(I),xc(I),"filled")
hold off
legend(["Cross-correlation",sprintf("Maximum at lag %d",lags(I))])
Confirm the result using the finddelay function.
finddelay(x,y)
ans =
3

