Echo Cancellation
A speech recording includes an echo caused by reflection off a wall. Use autocorrelation to filter it out.
In the recording, a person says the word MATLAB®. Load the data and the sample rate, .
load mtlb

% To hear, type soundsc(mtlb,Fs)
Model the echo by adding to the recording a copy of the signal delayed by samples and attenuated by a known factor : . Specify a time lag of 0.23 s and an attenuation factor of 0.5.
timelag = 0.23;
delta = round(Fs*timelag);
alpha = 0.5;
orig = [mtlb;zeros(delta,1)];
echo = [zeros(delta,1);mtlb]*alpha;
mtEcho = orig + echo;
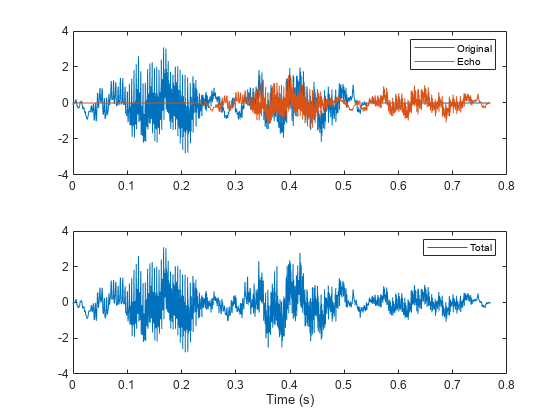
% To hear, type soundsc(mtEcho,Fs)Plot the original, the echo, and the resulting signal.
t = (0:length(mtEcho)-1)/Fs;

subplot(2,1,1)
plot(t,[orig echo])
legend("Original","Echo")

subplot(2,1,2)
plot(t,mtEcho)
legend("Total")
xlabel("Time (s)")
Compute an unbiased estimate of the signal autocorrelation. Select and plot the section that corresponds to lags greater than zero.
[Rmm,lags] = xcorr(mtEcho,"unbiased");

Rmm = Rmm(lags>0);
lags = lags(lags>0);

figure
plot(lags/Fs,Rmm)
xlabel("Lag (s)")
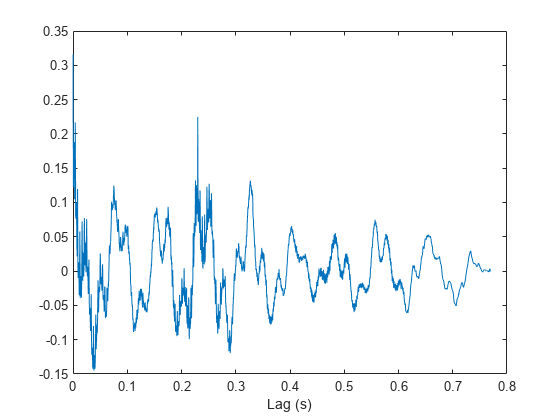
The autocorrelation has a sharp peak at the lag at which the echo arrives. Cancel the echo by filtering the signal through an IIR system whose output obeys .
[~,dl] = findpeaks(Rmm,lags,MinPeakHeight=0.22);
mtNew = filter(1,[1 zeros(1,dl-1) alpha],mtEcho);
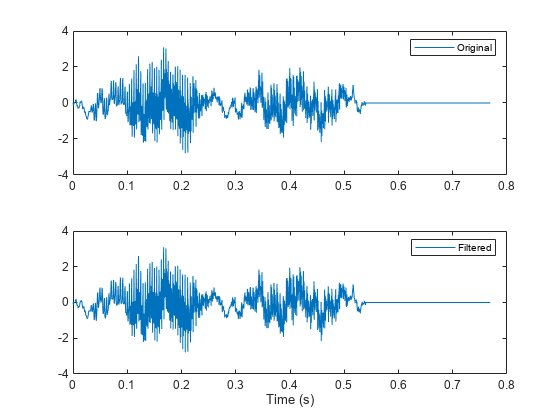
% To hear, type soundsc(mtNew,Fs)Plot the filtered signal and compare to the original.
subplot(2,1,1)
plot(t,orig)
legend("Original")

subplot(2,1,2)
plot(t,mtNew)
legend("Filtered")
xlabel("Time (s)")