Analyze Simulation Execution Using Simulink Profiler
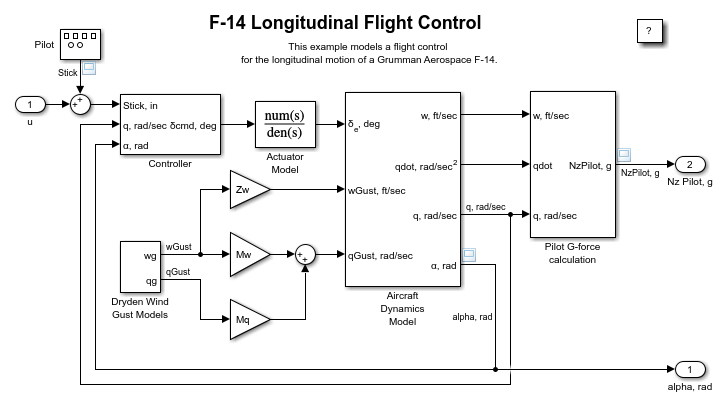
This example shows how to use the Simulink Profiler to examine the execution of the model slAccelDemoF14 in simulation. Use the Simulink Profiler to identify and remove performance bottlenecks in your model and to analyze the effect of modifying block and model parameters on simulation execution.
To analyze your model and simulation configuration settings for potential performance problems, use the Performance Advisor. The Performance Advisor generates suggestions for specific changes that might improve performance and can automatically apply each change and verify whether performance improved. For more information, see Improve Simulation Performance Using Performance Advisor.
For more information about accelerator and rapid accelerator simulation, see What Is Acceleration?
Open Example Model
Open the example, which contains the model slAccelDemoF14.
To profile a model using the Simulink Profiler, you run a profiling simulation. The profiling simulation measures and logs information about the simulation execution. Because the extra monitoring and logging incurs some performance overhead compared to a typical simulation, you need to run a profiling simulation by using the Simulink Profiler in the Simulink Editor or by programmatically enabling the Simulink Profiler for the simulation.
Analyze Model Using Simulink Profiler in Simulink Editor
To open the Simulink Profiler in the Simulink Editor, in the Simulink® Toolstrip, on the Debug tab, click the Performance button arrow and select Simulink Profiler.

To run the profiling simulation, in the Simulink Profiler, on the Profile tab, click Profile.
The Profiler Report pane displays the profiling results when the profiling simulation completes. By default, the Profiler Report pane displays the results using the model hierarchy view, with all nodes collapsed to show results only for the top model. To expand the results to view more detailed information, click the arrow (>) next to the row for the model slAccelDemoF14 in the table. Then, select a row in the table to view detailed profiling results for that model element in the Property Inspector.

You can share the profiling reports you generate using the Simulink Profiler with others by saving the report as an HTML file or as a MAT file. To save a profiling report:
In the Profiler Report pane, from the Run list, select the profiling report you want to save.
In the Profile tab, in the Results section, click Share. Then, select whether to generate an HTML report or export the profiling results to a MAT file.
Programmatically Analyze Model Using Simulink Profiler
You can also analyze models using the Simulink Profiler programmatically.
To open or load the model programmatically, use the open_system or load_system function.
mdl = "slAccelDemoF14";
open_system(mdl)
set_param(mdl,Profile="on")
To programmatically enable the Simulink Profiler, you can:
Use the
set_paramfunction to enable theProfileparameter for the model. The Simulink Profiler remains enabled for simulation until you disable theProfileparameter.Enable the
Profileparameter for a specific simulation by specifying the parameter as a name-value argument for thesimfunction, setting the parameter on aSimulationInputobject, or setting the parameter on aSimulationobject.
For this example, run the profiling simulation by specifying the Profile parameter as a name-value argument for the sim function.
out = sim(mdl,Profile="on");---- Collecting compile statistics for slAccelDemoF14
(SimType: SIM Accel: no ConfigForRTW: no)
Cannot access process memory counters on this platform
The profiling information is saved in the simulation metadata as a Simulink.profiler.Data object. Get the profiling results from the Simulink.SimulationOutput object that contains all the simulation results and metadata.
profresults = out.SimulationMetadata.TimingInfo.ProfilerData;
To save the profiling results in a MAT file, use the save function.
save("SimulinkProfilerResults.mat","profresults")
To save the profiling results as an HTML report, use the generateReport function. The HTML report is saved in the current working directory with a name that includes the time the profiling simulation ran and the name of the model.
generateReport(profresults)
To analyze the results using the Profiler Report pane and the Property Inspector:
Save the profiling results in a MAT file.
Open the Simulink Profiler.
On the Profile tab, click Load Previous.
Select the MAT file with the profiling results.
Click OK.
The Profiler Report pane shows the profiling results from the MAT file.