where
Display current location within simulation loop during simulation debugging session
Syntax
Description
where displays the current location within the simulation
loop for the debugging session, including information about the call stack.
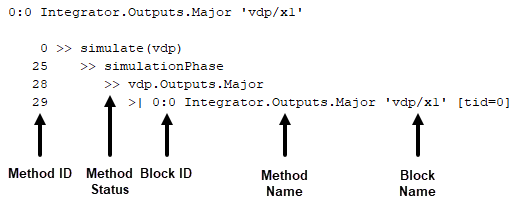
The display consists of a hierarchical list of simulation nodes, where the last node in the list indicates the next node the simulation will enter or the node the simulation is about to leave. Each entry in the list includes:
The method ID
A symbol that indicates the method status:
>>— Active method>|— Next method simulation enters<|— Method simulation is about to leave
The name of the method invoked
The block ID for the block on which the method is invoked, if the method is invoked on a block
The name of the block or system on which the method is invoked

You can use this function in a simulation debugging session started:
Note
This function is available only for simulation debugging sessions started programmatically and for interactive simulation debugging sessions while paused within a time step.
Tips
To start a simulation debugging session interactively, add one
or more breakpoints to your model, and in the Breakpoints List,
check that Pause within time step is selected. When the simulation pauses
on a breakpoint, some of the programmatic debugging commands, such as the
stop command, are available for use in the MATLAB® Command Window.