Main Content

Access, Manage, and Aggregate Coverage Results

After you Specify Coverage Options and collect coverage results, you can use the Results Explorer to access, manage, and aggregate the coverage data that you collect. After you aggregate the coverage results you need, you can then create a Top-Level Model Coverage Report or Export Model Coverage Web View using your aggregated coverage data.

Accessing Coverage Data from the Results Explorer

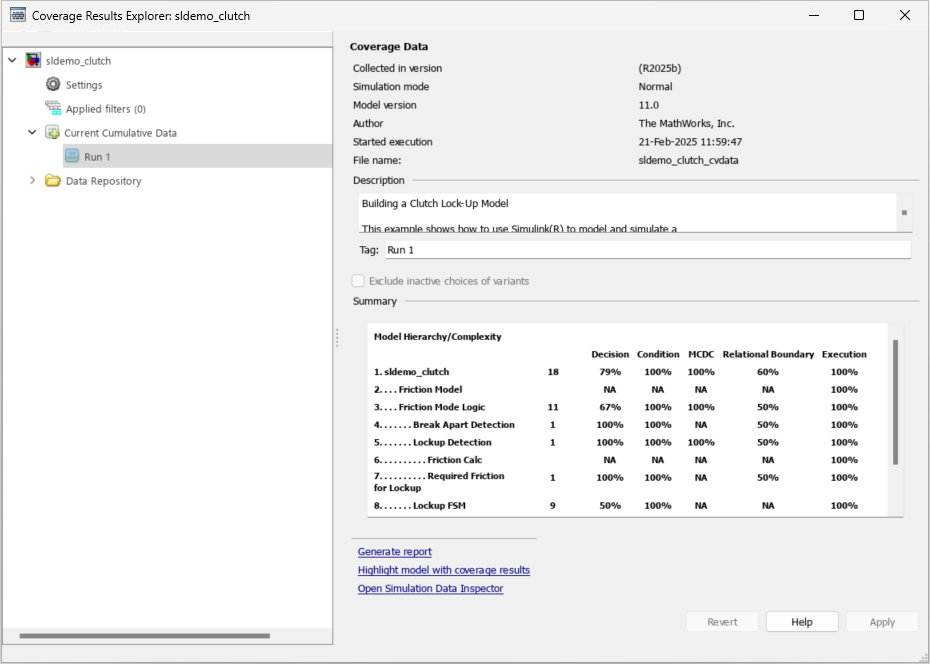
To open the Results Explorer after coverage analysis, in the Coverage Analyzer app, click on Results Explorer. The Results Explorer opens to show the most recent coverage run:

Default view of the Results Explorer. The system name is on the left, with sub-fields for settings, applied filters, current cumulative data, and data repository. The overview of the current run is on the right, including the model version, author, execution start time and date, coverage data file name, short description, and coverage summary.

You can view the current data results summary from within the Results Explorer or click Generate Report to create a full coverage report. If you do not make any changes to your model after you collect coverage, you do not need to re-simulate the model to generate a new coverage report. For more information on coverage reports, see Top-Level Model Coverage Report.

Select Exclude inactive choices of variants to filter out coverage results for inactive variant choices. Clear this option to receive coverage information about inactive variant choices. This option applies to variant blocks that have the Variant activation time set to Startup and to variant configurations in Stateflow® charts. For more information, see Model Coverage for Variant Blocks.

Click Highlight model with coverage results to provide highlighted results in your model that allow you to quickly see coverage results for model objects. For more information, see Overview of Model Coverage Highlighting.

Click Open Simulation Data Inspector to view the current selected run simulation data in the Simulation Data Inspector. The model must generate valid data that can be opened in the Simulation Data Inspector for this option to become available, for example, by selecting signals for signal logging. For more information about the Simulation Data Inspector, see View Simulation Data in Simulation Data Inspector.

Settings

In the coverage Results Explorer, you can access the data and reporting settings for your coverage data. To access these settings, click Settings.

Default Results Explorer Settings. On the right is a list of Settings available for edit.

OptionDescription

Enable collecting cumulative data

Aggregates coverage results from successive simulations, by default. You specify the name and output folder of the .cvt file in the Results section of the Configuration Parameters dialog box. For more information, see Cumulative Coverage Data.

Show cumulative progress report

Shows the Current Run coverage results, the Delta of coverage compared to the previous cumulative data, and the total Cumulative data from all current cumulative data separately in the coverage reports. If you do not select this option, only the total Cumulative data from all current cumulative data are shown.

Show report

Opens a generated HTML coverage report in a MATLAB® browser window at the end of model simulation. For more information, see Top-Level Model Coverage Report.

You access the HTML report from the Simulink® Coverage™ contextual tabs, which appear when you open the Coverage Analyzer app.

Generate Web View Report

Opens a generated Model Coverage Web View in a MATLAB browser window at the end of model simulation. For more information, see Export Model Coverage Web View.

Include each test in the model summary

At the top of the HTML report, the model hierarchy table includes columns listing the coverage metrics for each test. If you do not select this option, the model summary reports only the total coverage.

Show aggregated tests information

If you collect coverage for one or more subsystem harness, the Aggregated Tests section lists each unit test run. For more information, see Aggregated Tests.

Produce bar graphs in the model summary

Causes the model summary to include a bar graph for each coverage result for a visual representation of the coverage.

Use two color bar graphs (red, blue)

Red and blue bar graphs are displayed in the report instead of black and white bar graphs.

Display hit/count ratio in the model summary

Reports coverage numbers as both a percentage and a ratio, for example, 67% (8/12).

Exclude fully covered model objects from report

The coverage report includes only model objects that the simulation does not cover fully, useful when developing tests, because it reduces the size of the generated reports.

Exclude fully covered model object details from report

If you choose to include fully covered model objects in the report, the report does not include the details of the fully covered model objects

Include cyclomatic complexity numbers in summary

Includes the cyclomatic complexity (see Types of Model Coverage) of the model and its top-level subsystems and charts in the report summary. A cyclomatic complexity number shown in boldface indicates that the analysis considered the subsystem itself to be an object when computing its complexity. Boldface text can occur for atomic and conditionally executed subsystems and Stateflow Chart blocks.

Include cyclomatic complexity numbers in block details

Includes the cyclomatic complexity metric in the block details section of the report.

Filter Stateflow events from report

Excludes coverage data on Stateflow events.

Filter Execution metric from report

Excludes coverage data on Execution metrics

Include linked requirements in aggregate coverage report

If you run at least two test cases in Simulink Test™ that are linked to requirements in Requirements Toolbox™, the aggregated coverage report details the links between model elements, test cases, and linked requirements. For more information, see Requirement Testing Details.

Creating and Managing Filters

You can create, load, or edit filters for the current coverage data from within the Results Explorer.

  1. Open the Results Explorer.

  2. Click the Applied filters tab.

Default view of the Filter Editor pane of the Results Explorer. On the right there are 4 selections: New filter, Load filter, Make justification filter rules for dead logic (using Simulink Design Verifier), and Make justification filter rules for dead logic (using Polyspace Code Prover results).

OptionDescription

New filter

Creates a blank filter and opens the Filter Editor pane of the Coverage Results Explorer.

Load filter

Opens the Load filter selection window.

Make justification filter rules for dead logic (using Simulink Design Verifier™)

Launches Simulink Design Verifier design error detection. For more information, see Analyze Models for Design Errors (Simulink Design Verifier).

Make justification filter rules for dead logic (using Polyspace® Code Prover™ results)

Opens a file selection window which asks for a Polyspace Code Prover results file.

For more information on filtering model objects, see Creating and Using Coverage Filters.

Managing Coverage Data from the Results Explorer

After you collect coverage, you can manage the coverage data from the Results Explorer. To view coverage data details, under Current Cumulative Data, click the coverage data of interest. You can edit the description and tags for each run. Before you leave the coverage data details view, click Apply to apply your changes. Otherwise, the changes are reverted.

When you apply changes to coverage data, such as adding descriptions and tags, the data shows an asterisk next to its icon. To save these changes, right-click the data and click Save modified coverage data.

When you highlight the model with coverage results, the Coverage Results Explorer displays (H) next to Current Cumulative Data.

Accumulating Coverage Data from the Results Explorer

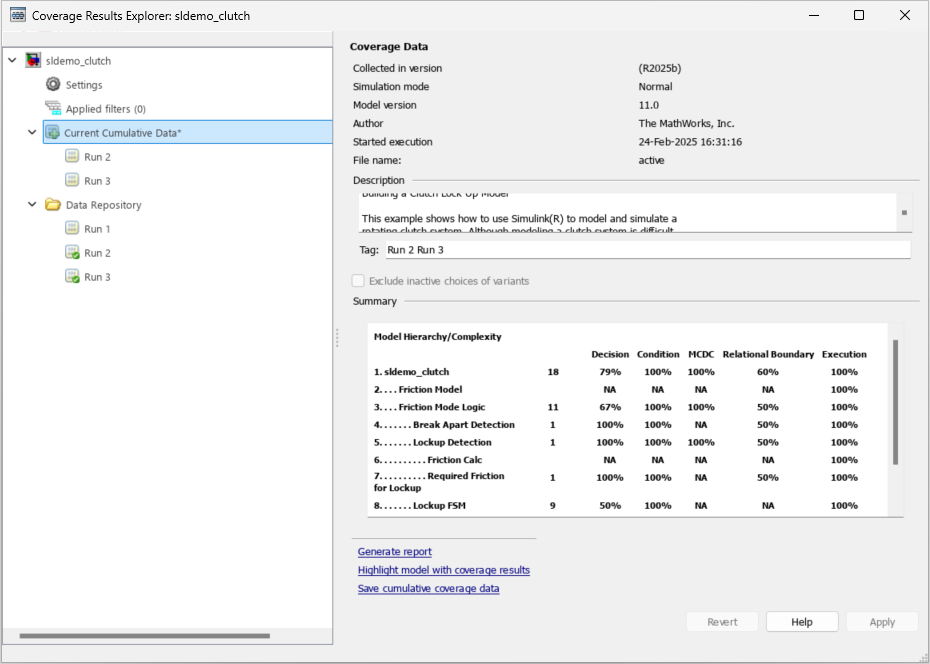
If you collect multiple coverage runs, each run is listed separately in the Data Repository. You can drag and drop runs from the Data Repository to the Current Cumulative Data to manage which runs to include in the cumulative coverage data. Alternatively, right-click runs in the Data Repository or the Current Cumulative Data to include or exclude them in the cumulative coverage data.

Default view of the Results Explorer with "Current Cumulative Data" selected. The overview of the current run is on the right, including the model version, author, execution start time and date, coverage data file name, short description, and coverage summary.

To save the current cumulative data set to a .cvt file, click Save cumulative coverage data. Alternatively, you can right-click the Current Cumulative Data and select Save cumulative coverage data.

Load Existing Coverage Data

The Data Repository contains the coverage data, which is saved to the Input folder. You specify the Input folder on the Configuration Parameters dialog box > Coverage > Results section, in the Output directory field.

Default view of the Results Explorer with "Data Repository" selected. On the right, the Simulink model and Input folder are displayed, as well as a Checksum for the current data.

To synchronize the data in the input folder and the data in the Data Repository, click Synchronize with the current coverage data folder.

To load existing coverage data to the Data Repository:

  1. Right-click the Data Repository.

  2. Select Load coverage data.

  3. Select existing coverage data for the current model and click Open.

See Also

|

Related Topics