ProfilerData
Data returned from profiler
Description
Internal format returned by profiler and displayed by using public functions.
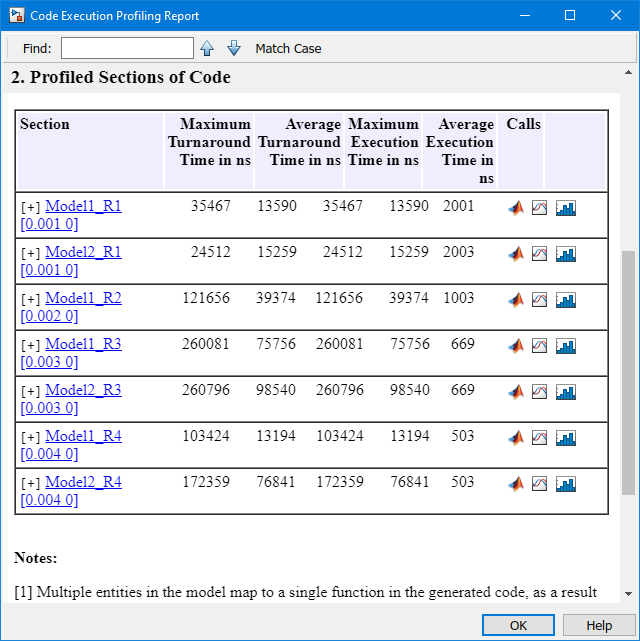
The Code Execution Profiling Report displays model execution profile results by task.
To display the profile data for a section of the model, click the membrane button
 next to the report section.
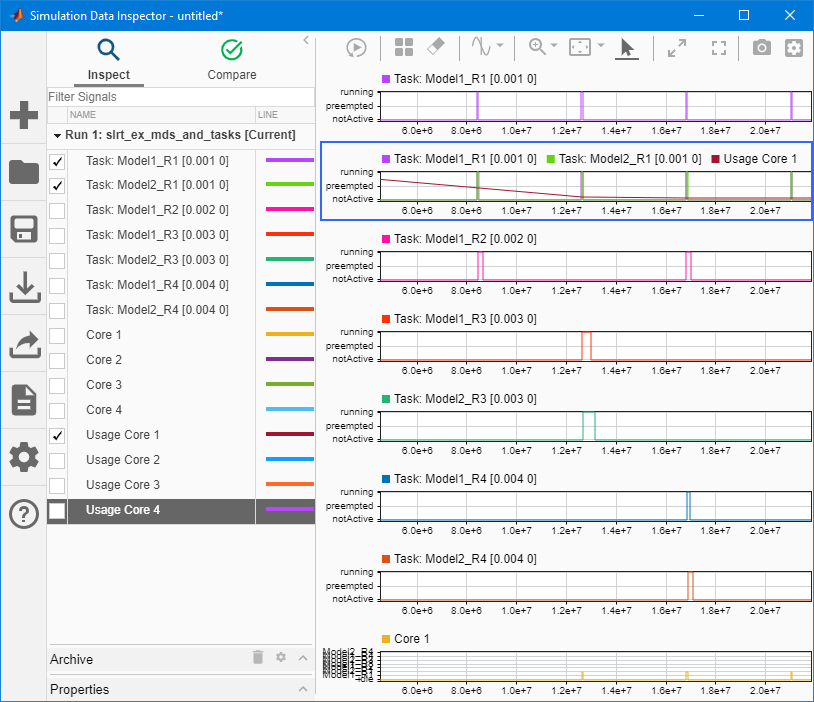
To display the TET data for the section in the Simulation Data Inspector, click the plot time series data button
 .
.To view the section in Simulink® Editor, click the link next to the expand tree button
 .
.To view the lines of generated code corresponding to the section, click the expand tree button
, and then click the view source button
 .
.
The Execution Profiler and the SLRT Overload Options block use different mechanisms to measure TET and do not generate identical TET values.
The maximum log file size for the profiler data is 1024 MB.
Creation
Examples
Load the application. Start the profiler. Start the
application. Stop the profiler. Retrieve profile execution data. Call
report and plot on the data.
tg = slrealtime;
mdlSTF = getSTFName(tg);
mdlName = 'slrt_ex_mds_and_tasks';
openExample(mdlName);
set_param(mdlName,"SystemTargetFile",mdlSTF);
slbuild(mdlName);
load(tg,mdlName);
startProfiler(tg);
start(tg);
stopProfiler(tg);
stop(tg);
profiler_object = getProfilerData(tg);
Processing data on target computer, please wait ...
Transferring data from target computer to host computer, please wait ...
Processing data on host computer, please wait ...

Code execution profiling data for model slrt_ex_mds_and_tasks.
report(profiler_object);
plot(profiler_object);
Version History
Introduced in R2020b
See Also
startProfiler | stopProfiler | getProfilerData | resetProfiler | Enable
Profiler | plot | report
Topics
- Execution Profiling for Real-Time Applications
- Code Profile Analyzer (Embedded Coder)