Main Content

Simulink Real-Time Performance Analyzer

R2026b

Visualize task execution timeline and CPU utilization for real-time application running on target computer

Since R2026b

Description

The Simulink® Real-Time™ Performance Analyzer transforms raw scheduler trace data from Speedgoat® target computers into an execution-centric visualization. Use this tool to identify performance bottlenecks, analyze task durations, and visualize CPU utilization without requiring kernel-level expertise.

Use Simulink Real-Time Performance Analyzer for these tasks:

  • View the task execution timeline showing thread-level activity for Base Rate and subrate tasks.

  • View CPU utilization across cores and identify task distribution.

  • Diagnose scheduling issues such as pre-emptions, voluntary sleeps, CPU migrations, and time-slicing.

  • Inspect execution segments to view thread names, scheduler timestamps, and CPU core assignments.

  • Export the timeline visualization as a PNG image.

Visual Indicators

The Performance Analyzer uses color-coded outlines on timeline bars to diagnose scheduling behavior:

Outline ColorConditionRecommended Action
RedThread preemptedCheck real-time priority assignments.
AmberInterrupted sleep inside a cycle (for example, nanosleep() pacing)Normal for rate threads. Duration grows as model time increases.
CyanCPU migration mid-cycleCheck CPU affinity and cache pressure.
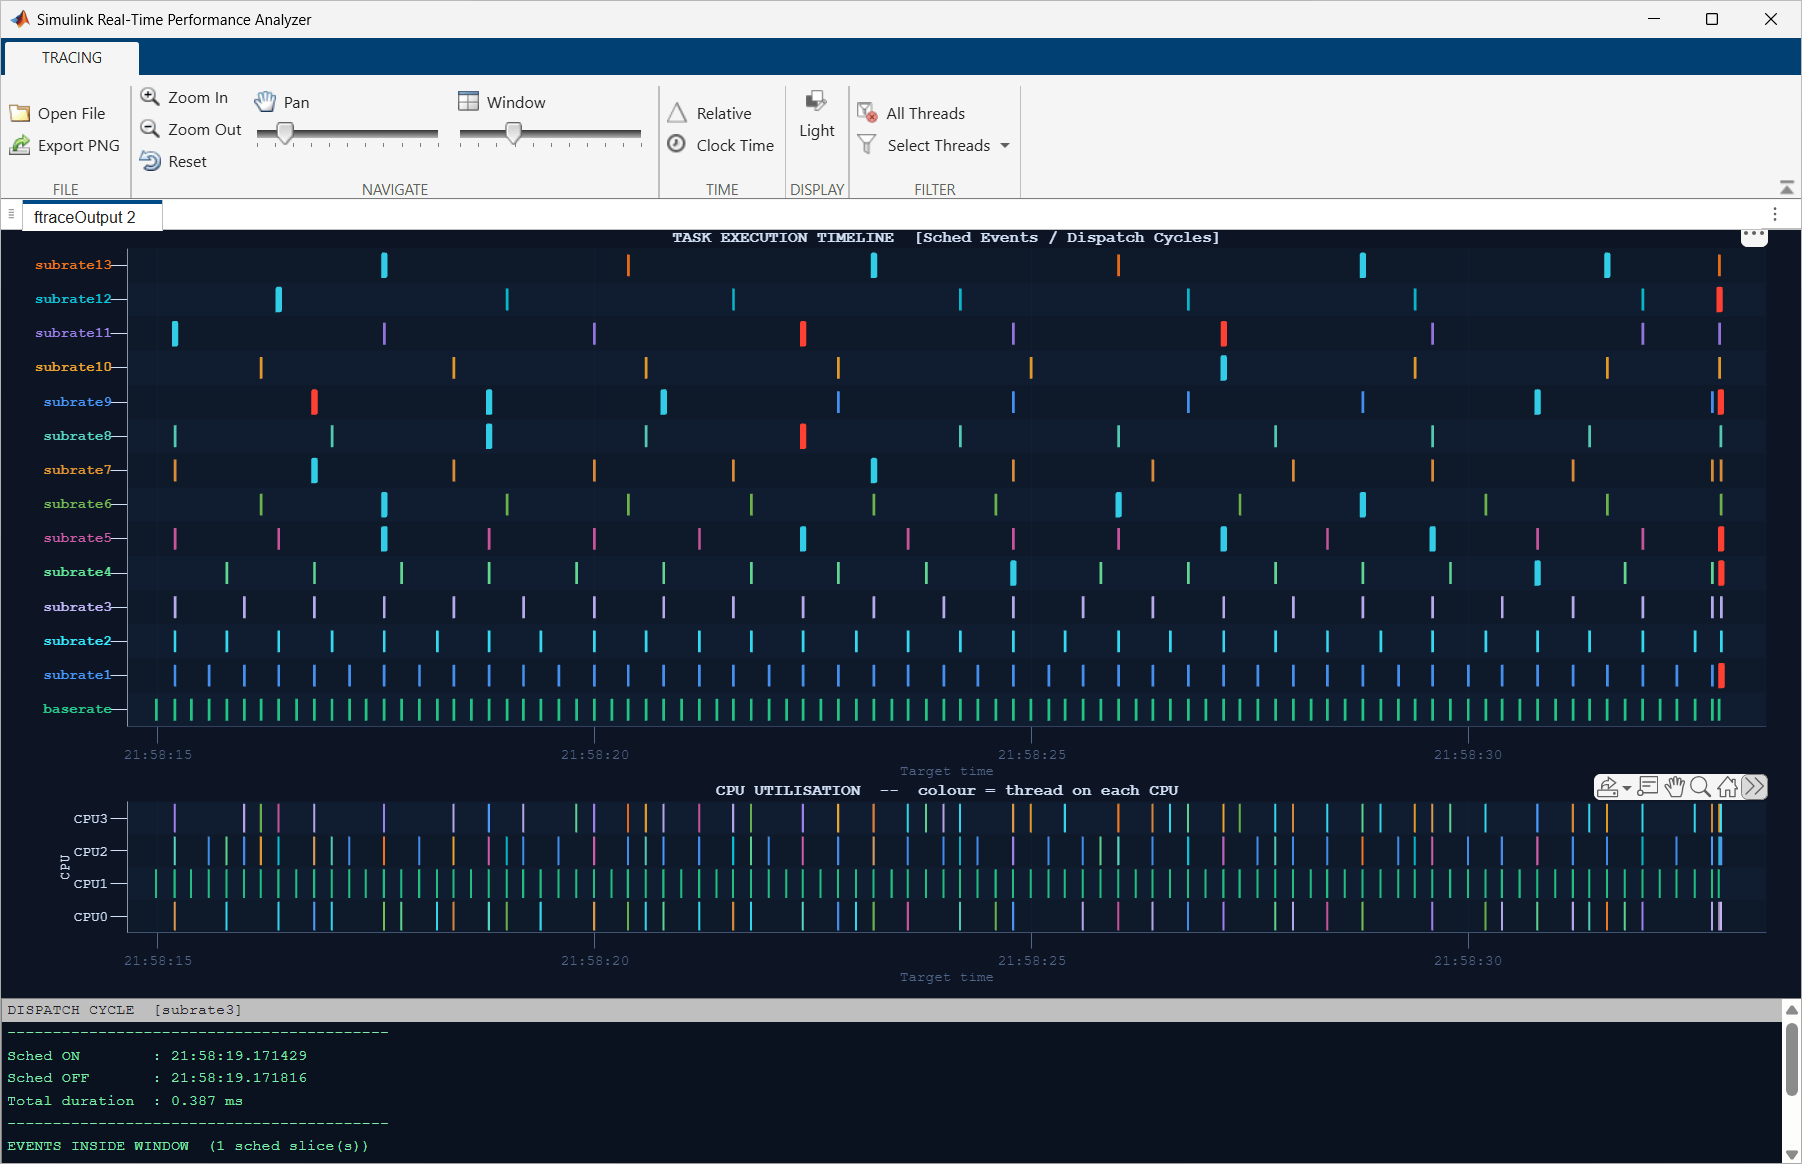
The Simulink Real-Time Performance Analyzer displaying trace events.

Open the Simulink Real-Time Performance Analyzer App

From the MATLAB® Command Window, type:

slrtPerformanceAnalyzer('ftraceOutput.txt')

You can also open the tool without specifying a file. In the Command Window, type:

slrtPerformanceAnalyzer

Then click Open File in the toolstrip to load a trace data file.

Before you open the tool, you must collect trace data from the target computer. To collect trace data:

  1. Build and load the real-time application on the target computer.

    slbuild(modelName);
    load(tg,modelName);

  2. Start the tracer before you start the application.

    startTracer(tg);

  3. Start the real-time application.

    start(tg);

  4. Stop the tracer to save data on the target computer.

    stopTracer(tg);

  5. Retrieve the trace data from the target computer.

    getTracerData(tg);

Examples

expand all

This example shows how to collect trace data from a Speedgoat target computer and analyze task execution performance by using the Performance Analyzer.

Open an example Simulink model. In the Command Window, type:

open_system("slrt_ex_osc_rt.slx");

Build and load the real-time application on the target computer.

modelName = 'slrt_ex_osc_rt';
slbuild(modelName);
tg = slrealtime;
load(tg,modelName);

Start the tracer, run the application, and then stop the tracer.

startTracer(tg);
start(tg);
pause(10);
stop(tg);
stopTracer(tg);

Retrieve the trace data from the target computer to the host.

getTracerData(tg);

Open the Performance Analyzer to visualize the trace data.

slrtPerformanceAnalyzer('ftraceOutput.txt');

Use the Task Execution Timeline to view thread-level activity for BaseRate and subrate tasks. Click a bar to view execution segment details such as thread name, scheduler timestamps, and CPU core assignment.

Use the CPU Utilization panel to view task distribution across CPU cores.

Parameters

expand all

Load a new ftraceOutput.txt file and reset the timeline views.

Save the currently visible timeline as a PNG image file.

Use the Select Threads dropdown to filter which threads are visible in the timeline and CPU utilization views. The dropdown displays a checkbox list of all threads found in the trace file, such as baserate, main, or subrateX threads. Clear a checkbox to hide that thread from the views. Click All Threads to reset the filter and show all threads.

Drag the pan slider to scroll the visible time window left or right along the execution timeline. Use this control to navigate to different segments of the captured trace data without changing the zoom level.

Drag the window slider to set the width of the visible time window. Move the slider to the right to show the full trace duration or to the left to show a narrower, zoomed-in view of the timeline. This control adjusts the scale of the time axis to switch between a high-level overview and a detailed view of task execution segments.

Reset the timeline view to show the full trace duration and restore the default pan position.

Expand the time axis to view a smaller time interval in greater detail.

Compress the time axis to view a larger time interval.

Toggle the time axis between relative time (seconds since trace start) and clock time (wall-clock UTC).

Toggle the user interface color theme between light and dark mode.

Programmatic Use

slrtPerformanceAnalyzer opens the Simulink Real-Time Performance Analyzer without loading a file. Use Open File in the toolstrip to load a trace data file.

slrtPerformanceAnalyzer(traceFile) opens the Simulink Real-Time Performance Analyzer and loads the trace data from the specified file. The file can be a .txt or .log ftrace output file.

Tips

  • You do not need to recompile the application to collect trace data. You can start tracing on an existing loaded application.

  • Click a bar in the Task Execution Timeline to view execution segment details, including the thread name, cycle state, raw sched_switch timestamps, and the CPU core number.

  • The red outline on a timeline bar indicates the thread is preempted and cyan indicates that the thread is migrated.

Version History

Introduced in R2026b