Main Content

exprprofrange

Calculate range of gene expression profiles

Syntax

Range = exprprofrange(Data)
[Range, LogRange] = exprprofrange(Data)
... = exprprofrange(Data, 'ShowHist', ShowHistValue)

Arguments

Data DataMatrix object or numeric matrix of expression values, where each row corresponds to a gene.
ShowHistValue

Controls the display of a histogram with range data. Default is:

  • false — When output values are specified.

  • true — When output values are not specified.

Description

Range = exprprofrange(Data) calculates the range of each expression profile in Data, a DataMatrix object or numeric matrix of expression values, where each row corresponds to a gene.

[Range, LogRange] = exprprofrange(Data) returns the log range, that is, log(max(prof))- log(min(prof)), of each expression profile. If you do not specify output arguments, exprprofrange displays a histogram bar plot of the range.

... = exprprofrange(Data, 'ShowHist', ShowHistValue) controls the display of a histogram with range data. Choices for ShowHistValue are true or false.

Examples

collapse all

Load microarray data containing gene expression levels of Saccharomyces cerevisiae (yeast).

load yeastdata

This MAT-file includes three variables, which are added to the MATLAB® workspace:

  • yeastvalues - A matrix of gene expression data

  • genes - A cell array of GenBank® accession numbers for labeling the rows in yeastvalues

  • times - A vector of time values for labeling the columns in yeastvalues

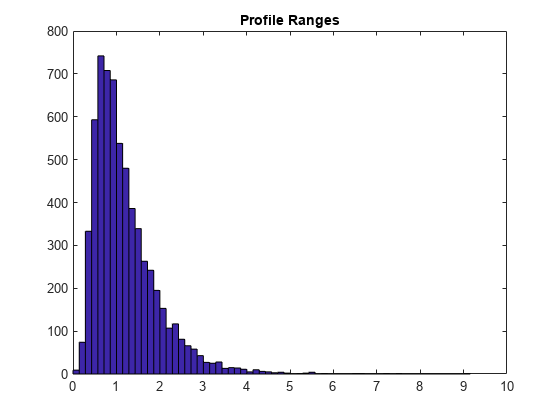
Calculate the range of expression profiles for yeast data as gene expression changes during the metabolic shift from fermentation to respiration. And display a histogram of the data.

range = exprprofrange(yeastvalues,'ShowHist',true);

Figure contains an axes object. The axes object with title Profile Ranges contains an object of type patch. This object represents absrange.

Version History

Introduced before R2006a
Go to top of page